


Who Received The Orders? Latest Global Footwear Order Overview
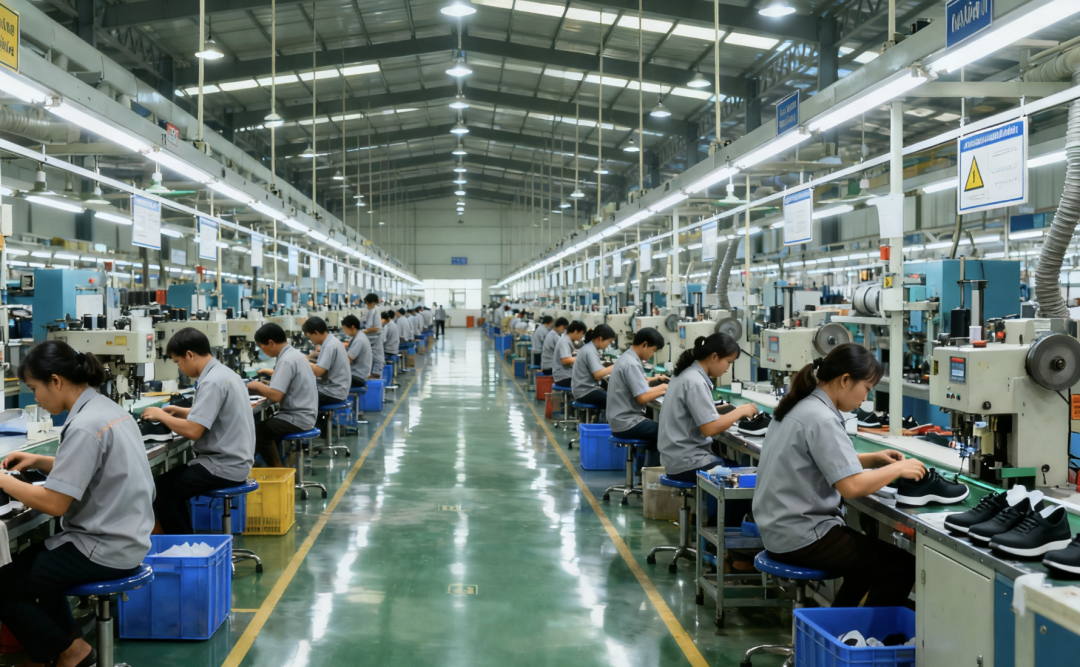
Note: The cover and illustrations are generated by AI.
On October 15, 2025, World Footwear announced the latest data on global footwear trade.
In the first eight months, China's export volume fell by 2%, and export value declined by nearly 9%. The United States saw a 4.6% increase in import value from January to July, but the quantity remained almost flat. The European Union and Japan experienced increases in both volume and price.
The report also pointed out that a large influx of low-cost shoes from China has impacted the Brazilian market. This indicates signs of adjustment in the global footwear supply chain.
Who has risen? Who has fallen behind?
The shipments haven't increased much, but the prices have already gone up.
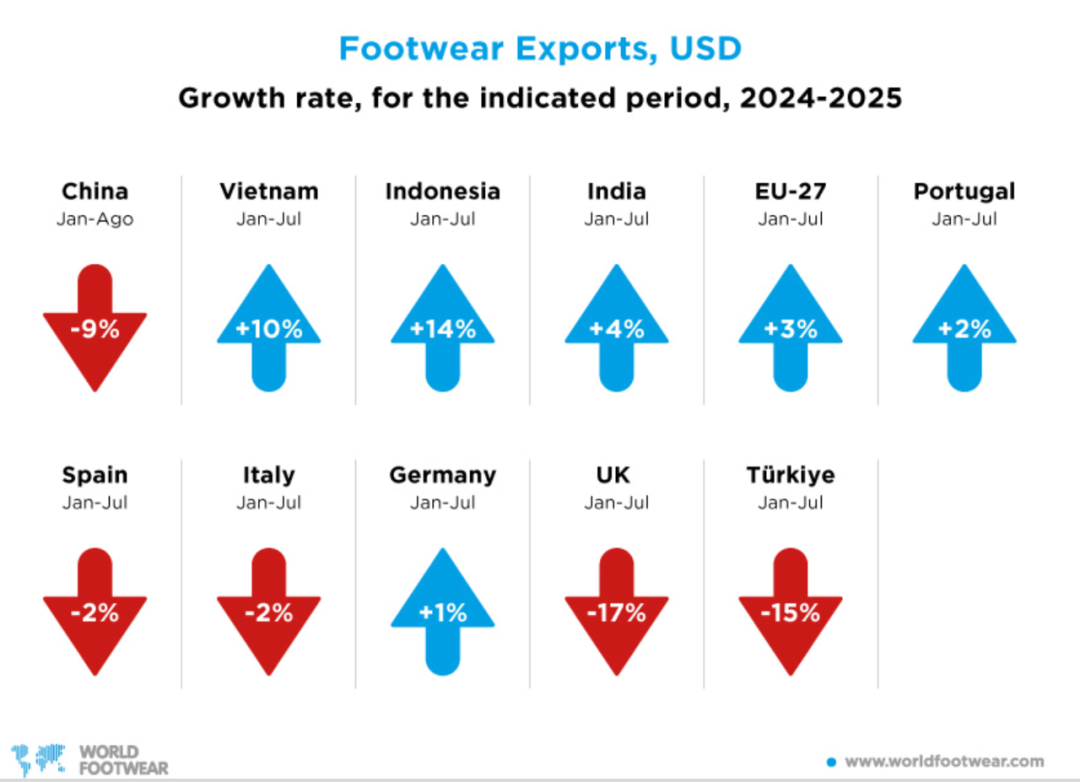
World Footwear report screenshot
China: From January to August, exports reached 605 million pairs (–2%), with a value of 28.9 billion USD (–8.8%).
Vietnam/Indonesia/India: Export values from January to July increased by +9.5% / +13.6% / +3.7% respectively, showing an overall increase.
From January to July, the United States imported 1.3 billion pairs valued at $16 billion, with a quantity increase of 0.4% but a value increase of 4.6%. This indicates that prices have risen while quantities have remained stable, resulting in an increase in the average landed price.
EU: From January to July, 1.9 billion pairs imported/32.6 billion euros, volume up 11.2%, value up 9%. Japan: volume +4.1%, value +14.7%, showing simultaneous "volume and price increase." Meanwhile, there is a divergence within the EU, with slight increases in Portugal and Germany, while Spain and Italy experienced a slight decline.
From January to July, Brazil's imports saw a significant increase of 28.8% compared to the same period last year. Imports from China in 2025-08 rose by 41.5% in volume and by 67.2% in value. The Brazilian Footwear Association (Abicalçados) stated that exports to the US are "practically unviable" under the new tariffs, which aligns with the recent intensification of competition from China.
The U.S. Footwear CPI (BLS) shows that in August 2025, the year-on-year increase in the footwear CPI was +1.4% and the seasonally unadjusted month-on-month increase was +0.8%. The industry perspective also indicates that retail prices are rising, which corroborates with the "volume flat, price increase" structure of imports.
The shoes have increased in price.
Simply put, it's not that more were sold, but rather they became more expensive.
Tariffs are driving up prices: the import volume to the U.S. has hardly increased in the first seven months, but the value has risen. This indicates that the same pair of shoes is being bought at a higher price. The increase in tariffs and compliance costs (as repeatedly warned by the FDRA and corporate open letters), combined with production transfer frictions, has raised the unit cost of goods at the port—this can be inferred as a significant driver of price increases.
Changing production locations also incurs costs: when brands move orders to Vietnam or Indonesia, it is not without cost. Changing factories, changing materials, and obtaining certifications all initially raise prices. Although the quantity of shoes bought by Japan only increased slightly, the total amount increased significantly, indicating that even cheap shoes have become more expensive.
China remains the largest exporter: Although the share is changing, China is still the largest exporter.
It's not that it's selling out; it's just more expensive. As costs rise, prices naturally follow.
Whose family is joyful, and whose family is sorrowful?
Vietnam and Indonesia have passively increased their offers to the US, relying more on price hikes to maintain volume in the short term.
China's quantity and value have declined, but the foundation is still there. High-difficulty, urgent orders still have to come back to China for production.
The production capacity in the EU (Portugal, Italy, Spain, Germany) has slightly improved, but it is difficult to replace the large-scale production capacity of Asia. It is suitable for high-priced, small-batch, and fast-delivery orders, and not suitable for high-volume production.
Brazil's exports are constrained by U.S. tariffs, while domestic sales are impacted by low-priced shoes from China. If efficiency is not improved and regulatory shortcomings are addressed soon, the country may find itself squeezed from both sides. In August, low-priced shoes from China surged (volume +41.5%, value +67.2%), and Abicalçados stated that exports to the U.S. are "almost unfeasible."
It could also be "switched categories."
An increase in price does not necessarily mean that the same shoes are more expensive.
It may also be due to changes in structure—categories with higher price points such as running shoes, outdoor shoes, and work shoes have increased their proportion, raising the average price.
However, this judgment is currently only a speculation.
To verify, it is necessary to look at OTEXA's data by subcategory (quantity and amount) to calculate the average landed price ($/pair), and then compare it with the BLS footwear CPI and FDRA's monthly retail price report.
If both the unit price and CPI rise together, it indicates "structural price increase."
If all categories rise, it is more likely to indicate "price increase within the same category."
Three key uncertainties
Will the price of shoes in the United States continue to rise?
Whether the footwear CPI can increase year-on-year for three consecutive months and outperform the overall CPI is key to determining whether the consumer side can absorb the price increase.
Will the quotes from Vietnam and Indonesia to the US continue to rise?
The fourth quarter is the peak season for shipments. If the FOB average price in both locations rises for two consecutive months, it indicates that additional costs such as tariffs and certifications are gradually being factored into the price.
Will Chinese shoes continue to seize the market in Brazil?
If the proportion of shoe imports from China continues to increase in the Abicalcados and MDIC data, the profit margins of local brands will be further squeezed.
Follow-up Observation Points: Three Key Indicators to Watch Closely
U.S. Import Price Trend: Refer to OTEXA's monthly data (quantity/value) to calculate the average landed price (time window: August 2025 to January 2026).
The quantity-price difference in China's exports: When APICCAPS or World Footwear releases data for January to September, observe whether the widening scissors gap, where quantity falls slowly and value falls quickly, continues to expand. (To be checked when the next monthly report is published.)
Penetration rate of Chinese shoes in Brazil: Check the monthly data from Abicalcados and MDIC, focusing on whether the import share of Chinese shoes exceeds 30% and continues to rise (time window: September 2025 to February 2026).
Conclusion:
This year, it's not that "shoes sold out," but rather that "unit prices have risen." The quantity is hesitant, while prices are on the rise.
During periods dominated by "price leadership," who can minimize uncertainty regarding rules and costs?
【Copyright and Disclaimer】The above information is collected and organized by PlastMatch. The copyright belongs to the original author. This article is reprinted for the purpose of providing more information, and it does not imply that PlastMatch endorses the views expressed in the article or guarantees its accuracy. If there are any errors in the source attribution or if your legitimate rights have been infringed, please contact us, and we will promptly correct or remove the content. If other media, websites, or individuals use the aforementioned content, they must clearly indicate the original source and origin of the work and assume legal responsibility on their own.
Most Popular
-

AI Computing Power Demand Ignites Electronic Fabrics! China Jushi Hits Limit Up! Domestic Substitution Welcomes Golden Window
-

Focus on going global! kingfa sci. leads, huitong, preter, and kumho nire follow, china’s modified plastics frenziedly expanding worldwide
-

PA66 Cost and Profit: Broad-Based Weakness in the Feedstock Market Continues to Erode Cost Support for PA66 (202606)
-

Back-to-back major joker moves! covestro’s 1.32 million ton mdi dual-line expansion and hdi acquisition reshape global polyurethane landscape
-

Evonik Parts Ways With The Polyester Business! A Strategic Retreat By A Germany Chemical Giant And The Global Industry Shift


