


Which company is the fastest growing in solid-state battery materials?
According to data from GGII and China Commercial Industry Research Institute, China's solid-state battery shipments are expected to be about 7GWh in 2024, reaching 18GWh by 2027 and 30GWh by 2028, with a compound annual growth rate of 44% from 2024 to 2028. EVTank estimates that by 2030, global solid-state electrolyte shipments will reach 210,000 tons, with a total market size of 36.62 billion yuan.
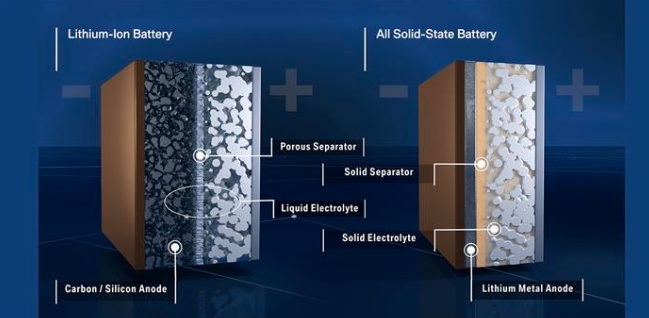
Solid-state batteries are developing towards high energy density. In terms of cathode materials, lithium-rich manganese-based and ultra-high nickel materials have become research hotspots. Anode materials are being upgraded to silicon-based/lithium metal, with silicon-based anodes having a theoretical specific capacity of up to 4200mAh/g, far exceeding that of graphite anodes. As technology matures, their application in solid-state batteries will continue to expand.
Value Breakdown of Each Segment in the Solid-State Battery Materials Industry Chain
Solid electrolytes account for 35%-40% of the value, making them the most valuable segment in the solid-state battery industry chain. Among them, sulfide electrolytes offer the best performance but have high production costs. However, as the localization of lithium sulfide progresses, there is significant potential for cost reduction in the future. Oxide electrolytes are easier to mass-produce and have already been used in semi-solid-state vehicle applications.
Positive and negative electrode materials: accounting for 25%-30%. The main positive electrode materials include high-nickel ternary and lithium-rich manganese-based materials, which are suitable for high energy density requirements. Negative electrode materials include silicon-carbon anodes and lithium metal anodes.
Current collectors and packaging: value accounts for 15%-20%. Aluminum-plastic film is the best packaging material for solid-state batteries, accounting for 15%-18% of the total cost of solid-state batteries. The current localization rate is low, and there is significant potential for increased penetration in the future.
Manufacturing equipment: accounting for 10%-15%. The production of solid-state batteries requires specialized equipment, such as dry electrode equipment, isostatic pressing equipment, and stacking machines. As the industrialization of solid-state batteries accelerates, the manufacturing equipment market will also experience growth.
Growth potential of solid-state battery material industry chain enterprises
The growth capability of an enterprise is the ability to continuously expand its asset scale, profitability, and market share in response to changes in the market environment, reflecting the future development prospects of the enterprise.
This article is part of the corporate value series on [Growth Capability]. A total of 57 companies from the solid-state battery materials industry chain have been selected as research samples, with compound growth in revenue, compound growth in net profit excluding non-recurring items, and compound growth in net operating cash flow as evaluation indicators.
The data is based on history and does not represent future trends; it is for static analysis only and does not constitute investment advice.
Silicon Treasure Technology No. 10
Industry Segmentation: Organosilicon
Growth Capabilities: Revenue compound growth of 21.24%, compound growth of non-recurring net profit of -26.90%, compound growth of operating net cash flow of 11.04%.
Performance Forecast: The latest average profit forecast is 331 million yuan, with an average growth rate of 39.45%.
Main products: Adhesives for construction are the primary source of profit, accounting for 50.84% of the profit, with a gross margin of 21.60%.
Company Highlights: Silibao Technology's main products are silicone sealants, hot melt adhesives, silane coupling agents, and silicon-carbon anode materials. The company's silicon-carbon anodes are primarily used in the preparation of high energy density lithium batteries, suitable for semi-solid and solid-state batteries.
9th Suotong Development
Industry Segmentation: NonMetal materials
Growth Capability: Revenue compound growth -10.19%, non-recurring profit compound growth 113.42%, operating net cash flow compound growth -74.17%
Performance Forecast: The latest average forecast of net profit is 1.027 billion yuan, with an average growth rate forecast of 276.87%.
Main products: Prebaked anodes are the primary source of profit, accounting for 95.46% of the profit, with a gross margin of 9.82%.
Company Highlights: The main business of Suntown Technology Group Co., Ltd. includes prebaked anodes, anode materials for lithium batteries, and film capacitors. The company has cooperatively developed silicon-carbon and silicon-oxygen composite anode materials and has achieved phased results.
8th Huayou Cobalt
Industry subdivision: Cobalt
Growth Capability: Revenue compound growth -8.08%, net profit excluding non-recurring items compound growth 22.71%, operating net cash flow compound growth 256.61%
Performance Forecast: The latest average net profit forecast is 56.11 billion yuan, with an average growth rate forecast of 35.06%.
Main products: Nickel products are the primary profit source, accounting for 36.83% of the profit, with a gross profit margin of 27.10%.
Company Highlights: Huayou Cobalt's main business is new energy lithium battery materials and cobalt.New MaterialsThe product and the subsidiary will cooperate with Weilan New Energy in the field of solid-state batteries.
No. 7 Sanxiang Advanced Materials
Industry Segment: Non-metallic Materials
Growth Capability: Revenue compound growth -2.41%, net profit excluding non-recurring items compound growth -7.25%, operating net cash flow compound growth -11.06%.
Earnings Forecast: The latest average net profit forecast is 152 million yuan, with an average growth rate forecast of 100.88%.
Main products: Zirconium series products are the primary source of profit, accounting for 88.30% of the profit, with a gross margin of 26.38%.
Company Highlights: The main products of Sanxiang Advanced Materials are fused zirconia, sponge zirconium, zirconium oxychloride, other zirconium series products, and magnesium series products. The company uses self-produced zirconia as raw material to conduct synthesis experiments of solid electrolyte powder.
6. Dawn Holdings
Industry Subdivision: Modified Plastics
Growth capability: Revenue compound annual growth rate is 16.65%, compound annual growth rate of net profit excluding non-recurring items is 1.80%, and compound annual growth rate of operating net cash flow is negative.
Performance Forecast: The latest average net profit forecast is 204 million yuan, with an average growth rate forecast of 44.74%.
Main products: Modified plastics are the primary source of profit, accounting for 64.00% of the profit, with a gross margin of 10.56%.
Company Highlights: Combining current research results from foreign papers, Dawn Polymer's HNBR is expected to be applied in solid-state battery electrolytes, with successful laboratory examples already in place.
5th Kaisheng Technology
Industry Segment: Panel
Growth Capability: Revenue compound growth -2.32%, compound growth of net profit excluding non-recurring items is negative, compound growth of operating net cash flow is 8.23%.
Earnings Forecast: The latest average net profit forecast is 227 million yuan, with an average growth rate of 62.14%.
Main products: Display materials are the primary source of profit, accounting for 73.91% of profit, with a gross profit margin of 17.43%.
Company Highlight: The nano-zirconia products produced by Kaisheng Technology can be used as dopant materials for ternary lithium battery cathodes and solid-state battery electrolytes in the new energy sector.
4th Zhongke Electric
Industry Segmentation: Battery Chemicals
Growth ability: Revenue compound growth of 13.72%, net profit excluding non-recurring items compound growth of 269.37%, and compound growth of operating net cash flow is negative.
Earnings Forecast: The latest average net profit forecast is 635 million yuan, with an average growth rate of 109.57%.
Main products: Graphite-based anode materials are the primary source of profit, accounting for 100.00% of profits, with a gross profit margin of 19.94%.
Company Highlights: Zhongke Electric's main businesses are the lithium battery anode business and the magnetic electrical equipment business. The silicon-based anode pilot production line has been completed, and products have been sent to customers for testing and have received approval.
3rd Limin Co., Ltd.
Industry Segment: Agrochemical Products
Growth Capabilities: Revenue compound growth of 0.32%, net profit excluding non-recurring items compound growth of 12.52%, operating net cash flow compound growth of -20.70%.
Performance Forecast: The latest average prediction of net profit is 482 million yuan, with an average forecast growth rate of 492.8%.
Main products: Agricultural fungicides are the primary source of profit, accounting for 71.82% of the profit, with a gross profit margin of 27.54%.
Company Highlights: Liming Co., Ltd.'s main business is the research and development of pesticide active ingredients, formulations, veterinary active pharmaceutical ingredients, formulations, and feed additives. The company is focused on developing projects related to electrolyte lithium salts and functional additives for new energy batteries.
Second Dow Theory
Industry Segmentation: Battery Chemicals
Growth Capability: Revenue compound growth of 6.25%, non-recurring profit compound growth of 333.47%, operating net cash flow compound growth of 105.93%.
Performance Forecast: The latest average forecast for net profit is 558 million yuan, with an average growth rate of 255.95%.
Main products: Other businesses are the primary source of profit, accounting for 58.79% of the profit, with a gross margin of 32.93%.
Company Highlights: Daozhi Technology has fully established a presence in core material fields required for solid-state batteries, including single-wall carbon nanotubes, high-nickel ternary precursors, lithium-rich manganese-based precursors, silicon-based anodes, and solid-state electrolytes.
Shanghai Cleaning Expert No. 1
Industry Segmentation: Water Services and Water Management
Growth Capability: Revenue Compound Growth -5.80%, Net Profit Excluding Non-recurring Items Compound Growth -57.69%, Operating Net Cash Flow Compound Growth -39.33%
Performance Forecast: The latest average forecast of net profit is 141 million yuan, with an average forecast growth rate of 227.7%.
Main products: The operation and management of water treatment systems is the primary source of profit, accounting for 29.12% of the profit, with a gross profit margin of 32.15%.
Company Highlights: Shanghai XiBa has reserved other solid electrolyte powder technology routes such as sulfides and chlorides.
【Copyright and Disclaimer】The above information is collected and organized by PlastMatch. The copyright belongs to the original author. This article is reprinted for the purpose of providing more information, and it does not imply that PlastMatch endorses the views expressed in the article or guarantees its accuracy. If there are any errors in the source attribution or if your legitimate rights have been infringed, please contact us, and we will promptly correct or remove the content. If other media, websites, or individuals use the aforementioned content, they must clearly indicate the original source and origin of the work and assume legal responsibility on their own.
Most Popular
-

AI Computing Power Demand Ignites Electronic Fabrics! China Jushi Hits Limit Up! Domestic Substitution Welcomes Golden Window
-

Focus on going global! kingfa sci. leads, huitong, preter, and kumho nire follow, china’s modified plastics frenziedly expanding worldwide
-

Back-to-back major joker moves! covestro’s 1.32 million ton mdi dual-line expansion and hdi acquisition reshape global polyurethane landscape
-

Evonik Parts Ways With The Polyester Business! A Strategic Retreat By A Germany Chemical Giant And The Global Industry Shift
-

PA66 Cost and Profit: Broad-Based Weakness in the Feedstock Market Continues to Erode Cost Support for PA66 (202606)


