


Wanhua Chemical's Petrochemical Business Surpasses Polyurethane Segment With Revenue of 59.3 Billion Yuan; What Big Game Is Wanhua Chemical Playing Next?
Source: Wanhua Chemical
In October 2025, Wanhua Chemical's Q3 report may seem flat, but it contains hidden insights: the company's revenue for the first three quarters was 144.226 billion yuan, with a net profit of 9.157 billion yuan, both showing a year-on-year decline.
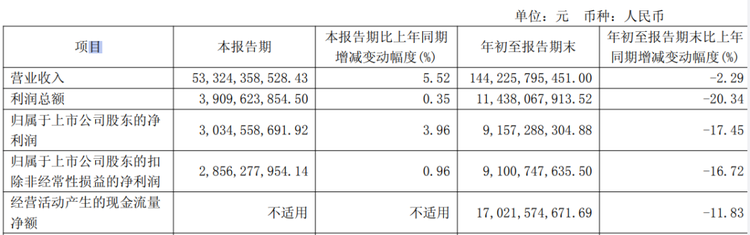
However, behind this overall decline in data, a historic turning point quietly emerged: the revenue from the petrochemical business reached 59.319 billion yuan, surpassing the polyurethane business's 55.143 billion yuan for the first time, becoming the company's new largest source of income.
For Wanhua Chemical, whose main products are MDI and TDI and which controls more than one-third of the global market share, this change is by no means a simple business ranking adjustment. It clearly points to a core issue: how can Wanhua Chemical, under the general pressure faced by the global chemical industry, demonstrate the strategic resilience of a leading enterprise through counter-cyclical investments and diversified layouts?
Strategic Implications Behind Structural Changes
Wanhua Chemical is undergoing a profound transformation from "single-pole drive" to "multi-pole growth." This structural change is not just a reordering of revenue figures but also a strategic choice for the company to counter industry cycles.
The polyurethane series, once a "cash cow," has maintained a high gross profit margin of around 26%, but its growth ceiling has become apparent. In contrast, the petrochemical business, although it has a gross profit margin of only about 3%, has brought significant economies of scale and synergy advantages, opening up new growth opportunities for the company.
Notably, this transformation is not a passive response but a proactive move. Wanhua Chemical's "counter-cyclical investment" strategy is exceptionally resolute. By the end of the third quarter, the company's total assets reached 328.324 billion yuan, an increase of 11.93% from the beginning of the year; its fixed assets and construction in progress amounted to nearly 190 billion yuan, up 4.37% from the beginning of the year. Maintaining such a large-scale capital expenditure during an industry downturn highlights the company's strategic determination.
The Paradox of Scale and Profit: How to Balance Revenue Growth and Profitability?
Although the petrochemical business has a large revenue scale, its thin profitability sharply contrasts with the polyurethane business. This "scale and profit" paradox is a key test of Wanhua Chemical's management wisdom. So, how does the company maintain overall operations under the pressure of declining industry prices?
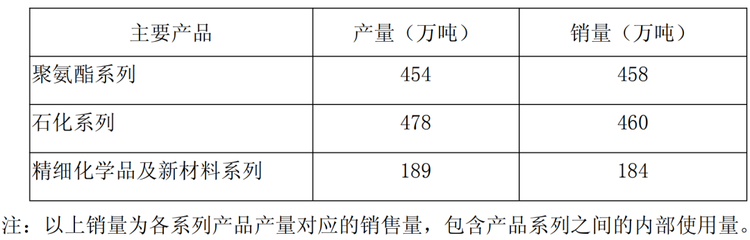
The answer lies in "increasing volume to compensate for price" and cost control. In the third quarter, the company's three main business segments all achieved significant year-on-year sales growth. The sales volumes of the company's polyurethane, petrochemical, and fine chemicals businesses reached 4.58 million tons, 4.6 million tons, and 1.84 million tons, respectively, with year-on-year growth rates of 9.9%, 32.6%, and 30.0%. Driven by the release of new production capacity, the company expanded its market share to offset the pressure of declining product prices.
From the perspective of product prices, the challenges faced by the industry are indeed severe: in the third quarter, the price of pure MDI was around 18,300 yuan/ton, and polymeric MDI was around 15,200 yuan/ton; among petrochemical products, the price of propylene fell by 6.83% year-on-year, and n-butanol dropped significantly by 20.57%. Cost control has become a crucial buffer. The larger decline in raw material prices (pure benzene, coal) has provided the company with significant profit buffer space, which also explains why Wanhua Chemical's overall gross profit margin only decreased by 1.94 percentage points year-on-year despite profit pressures in the first three quarters.
The Courage of Counter-Cyclical Deployment: Is an Industry Downturn a Time for Retrenchment or Expansion?
In 2025, the pace of capacity expansion at Wanhua Chemical has significantly accelerated, with these actions directly targeting an industry-wide issue: how should companies make decisions in the face of a downward cycle?
Wanhua Chemical's choice is to go against the tide. From the advancement of TDI and MDI projects in Fujian to breakthroughs in the fields of new energy and new materials (such as battery-grade lithium iron phosphate and optical-grade MS resin), these counter-cyclical layouts not only consolidate existing advantages but also reserve production capacity for the industry's recovery.
The support point of this strategy lies in forward-looking organizational preparation. This year, Wanhua Chemical has established more than seven times the number of subsidiaries compared to 2023, strategically positioning them around major bases to prepare for the reception of upcoming new production capacities. This fully demonstrates that counter-cyclical investment is by no means blind expansion, but rather a strategic advancement with supporting facilities and steps.
Innovation-driven and global perspective
Technological innovation is another important pillar for Wanhua Chemical to navigate through cycles.
In the first three quarters, the company applied for 469 domestic and international invention patents and was granted 269 new ones. From bio-based 1,3-butanediol to polysulfone materials, and then to automotive-grade optical polycarbonate materials, Wanhua Chemical's R&D achievements are bearing fruit in multiple fields.
In terms of global layout, the company acquired the special isocyanate business of France's Covestro through its Hungarian subsidiary, Bosted Chemical, gaining an annual production capacity of 20,000 tons of IPDI. This acquisition not only brought production capacity and technology but, more importantly, provided a local production base and sales network in Europe.
In terms of global expansion, Wanhua Chemical has further deepened its strategic cooperation with international partners. A typical example is the Kuwait Petrochemical Industries Company injecting an additional $638 million into Wanhua Chemical (Yantai) Petrochemical Co., Ltd., acquiring a 25% stake, which enhances the security of the company's petrochemical raw material supply. Additionally, Wanhua Chemical's collaboration with ENGEL and Hi-Tech Corporation provides integrated molding solutions for the automotive industry, among others.
The Inspiration of the Wanhua Model: Diversification is "Good medicineStill ""Trap"?
Wanhua Chemical's transformation journey provides valuable insights for the plastics industry.
The first point is the value of diversification. The transition from being dominated by polyurethane to having three major businesses running in parallel has significantly enhanced risk resistance. However, this implies a key question: Is diversification suitable for all companies? The Wanhua case shows that successful diversification requires strong financial strength and market position as support, and its counter-cyclical strategy cannot be emulated by all companies. This suggests to industry peers that strategic choices must be based on their own reality to avoid blindly following trends.
Furthermore, internationalization is an inevitable choice. Through overseas acquisitions, joint ventures, and cooperation, Wanhua Chemical is accelerating its global expansion. This not only helps to avoid trade barriers but is also an important way to acquire technology, markets, and resources.
Looking ahead, the long-term goal path for Wanhua Chemical has become clear. Under the theme of a "year of transformation," the company is undergoing a profound shift from scale-oriented to efficiency-oriented. This ultimately points to a more forward-looking question: When the next industry recovery arrives, where will your enterprise stand? Wanhua Chemical's experience shows that industry downturns are also a window of opportunity for leading companies to expand their competitive advantage. For peers, it is crucial not only to focus on survival but also to consider how to accumulate strength for future recovery through strategic adjustments, efficiency improvements, and innovation cultivation.
Edited by: Lily
Source of materials: DT New Materials, Chemical New Materials, Wanhua Chemical Financial Reports, etc.
【Copyright and Disclaimer】This article is the property of PlastMatch. For business cooperation, media interviews, article reprints, or suggestions, please call the PlastMatch customer service hotline at +86-18030158354 or via email at service@zhuansushijie.com. The information and data provided by PlastMatch are for reference only and do not constitute direct advice for client decision-making. Any decisions made by clients based on such information and data, and all resulting direct or indirect losses and legal consequences, shall be borne by the clients themselves and are unrelated to PlastMatch. Unauthorized reprinting is strictly prohibited.
Most Popular
-

AI Computing Power Demand Ignites Electronic Fabrics! China Jushi Hits Limit Up! Domestic Substitution Welcomes Golden Window
-

Focus on going global! kingfa sci. leads, huitong, preter, and kumho nire follow, china’s modified plastics frenziedly expanding worldwide
-

Back-to-back major joker moves! covestro’s 1.32 million ton mdi dual-line expansion and hdi acquisition reshape global polyurethane landscape
-

Evonik Parts Ways With The Polyester Business! A Strategic Retreat By A Germany Chemical Giant And The Global Industry Shift
-

PA66 Cost and Profit: Broad-Based Weakness in the Feedstock Market Continues to Erode Cost Support for PA66 (202606)


