


Using Three Different Sized Twin-Screw Extruders to Understand the Importance of Specific Mechanical Energy in Process Scale-Up
Introduction: The commercialization of a product involves several steps, including conception, design, development, laboratory-scale demonstration, application testing and performance, pilot-scale verification and validation, and finally production-scale certification. Products produced through twin-screw extrusion also need to follow this workflow, and a critical step for their successful commercialization isBridging the gap between laboratory scale and production scale. To this end, conducting medium-scale process studies is beneficial, as it allows for a better understanding of the limitations of a particular process.
This article demonstrates how to useCompare mechanical energyThe scale-up production process involves preparing masterbatch using polyolefin resin and three additives. All raw materials are fed through the extruder's feed port (barrel 1). The diameters of the laboratory, pilot, and production scale TSE are respectively26mm, 40mm, and 92mmIn addition, the extruder is co-rotating, fully intermeshing, parallel, and has a similar screw configuration (length-to-diameter ratio of 44, outer diameter to inner diameter ratio of 1.55).
Laboratory-scale compounding was carried out on a 26 mm TSE.
The masterbatch was initially produced on a laboratory scale using a 26mm TSE. The development of the compounding process for new products typically requires multiple iterations to determine the optimal process variables, including screw design, throughput, screw speed, and temperature profile, to ensure consistent and reliable operation and to produce products that meet specific quality requirements. Once these parameters are established, they can serve as a reference for scale-up production.

Under optimized processing conditions, the produced masterbatch pellets have an SME of 0.083 kWh/kg. Source (all images): C. Escobar
A key parameter for scaling up TSE is the Specific Mechanical Energy (SME) input. SME refers to the energy per unit mass transmitted from the extruder drive motor through the screw to the compound being processed, and it also affects the performance of the final product. Therefore, matching SME also helps ensure product quality.
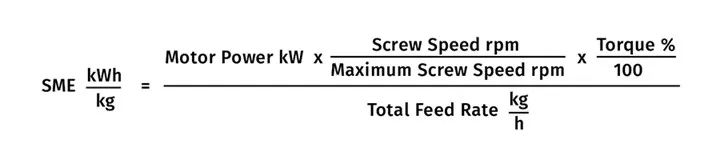
The SME of the process can be estimated using Formula 1. In this 26 mm case, the SME of the masterbatch mixed using optimized process variable values is 0.083 kWh/kg. Figure 1 shows a photo of the optimized masterbatch pellets.
Conducting pilot-scale compounding using a 40mm TSE.
There are two extremes regarding the achievable rates in scale-up production of twin-screw extrusion processes. If the scaled-up extruder is limited by power/volume, the maximum rate can be estimated by the cube of the extruder diameter ratio, as shown in Equation 2. If the scaled-up extruder is limited by barrel wall heat transfer, the maximum rate can be estimated by the square of the extruder diameter ratio, as shown in Equation 3.
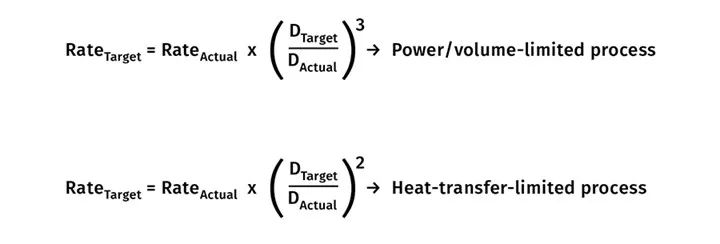
These scaling rules apply to extruders with screw combinations of similar geometry. In these formulas, D represents the extruder diameter, and "target" and "actual" refer to the extruder sizes to which the process will be scaled and the extruder size used to develop the process, respectively. For example, the "target" D is 40 mm, and the "actual" D is 26 mm.
The initial scale-up process for the 40 mm TSE adopted the same process conditions as the 26 mm TSE (optimized screw design, temperature profile, screw speed, etc.). Since there was no evidence indicating heat transfer limitations in the 26 mm TSE, the corresponding scale-up factor was estimated using Equation 2.
The initial compounding process with the 40 mm TSE exhibited significant and frequent pressure fluctuations, making the process unsustainable and unreliable, and also resulting in a marked decline in masterbatch quality. Therefore, process adjustments were made for optimization. After adjusting the process variables, the SME for masterbatch compounding was 0.055 kWh/kg (approximately 34% lower than the SME of the 26 mm TSE).
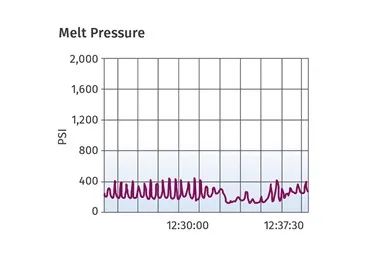
Figure 2A shows the pressure response over time during the initial compounding process on a 40 mm TSE, using the optimized variables obtained during process development on a 26 mm TSE.
Figures 2A, 2B, and 2C respectively show the initial pressure response, the adjusted pressure response, and the masterbatch obtained after optimization. Figures 2A and 2B display the variation of process pressure over time. In the initial stage (Figure 2A), the process pressure exhibits significant and frequent fluctuations over time.
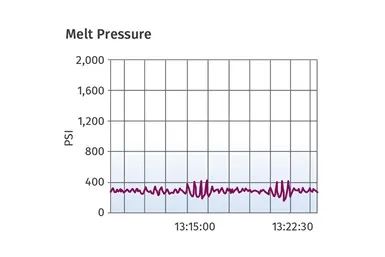
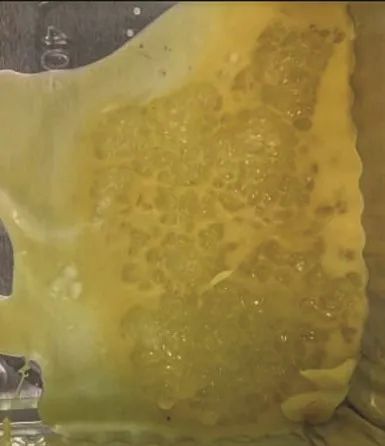
Figure 2C shows the segregation and poor mixing of masterbatch components. Figure 2B shows the change in pressure over time after adjusting the temperature profile, screw speed, and rate.
After adjusting the temperature profile, screw speed, and feed rate, the pressure response became more stable; however, significant short-term fluctuations still occurred over time, as shown in Figure 2B. Although the pressure response improved, the quality of the masterbatch deteriorated significantly, resulting in obvious phase separation and poor mixing of the compounded materials, and the material could not be pelletized, as shown in Figure 2C.
To address the significant differences in SME between laboratory and pilot scales and to improve the process, we made modifications to the screw design (increasing melting and mixing), the temperature profile (cooler), and the screw speed (reduced). Figures 3A, 3B, and 3C show that after implementing these improvements, the pressure response, mixing, and process stability were all enhanced.
Figure 3A shows a stable pressure response with negligible fluctuations over time. Similarly, Figure 3B shows an improved homogeneous melt with no signs of phase separation or poor mixing. Figure 3C indicates that process improvements allow the masterbatch to be pelletized. The improved process has an SME of 0.079 kWh/kg (approximately 5% lower than the SME of the 26 mm TSE). Additionally, the expected rate estimated according to Formula 2 has been achieved, which is 3.64 times higher than the rate of the 26 mm TSE.
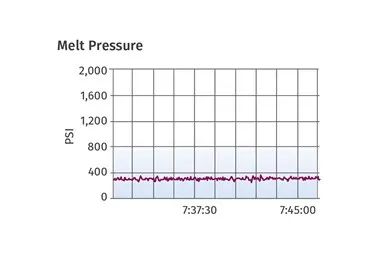

Figure 3A shows the pressure variation over time during the 40 mm TSE compounding process after adopting a new screw design and reducing processing temperature and screw speed. Figure 3B shows the uniform melt at the extruder discharge port.
Commercial-scale compounding using a 92 mm TSE
Similar to the scale-up transition from laboratory scale to pilot scale, optimized process conditions—namely the screw design, temperature profile, and screw speed of the 40 mm TSE—were employed during the scale-up from a 40 mm TSE to a 92 mm TSE. The corresponding scale-up factor for the 92 mm TSE was estimated using Equation 2. Surprisingly, the implementation of these conditions did not translate into a reliable and sustainable process on the commercial-scale extruder.
For example, Figure 4 shows a photo of a scrap bin located below the directional valve downstream of the 92 mm TSE. The photo shows some solid polymer particles being discharged from the extruder. The unevenness of the melt clearly indicates that when the optimized conditions used for the 40 mm TSE are applied to the 92 mm extruder, insufficient energy is transferred to the material. This is consistent with an SME input of 0.026 kWh/kg, which is 69% and 67% lower than the inputs for the 26 mm and 40 mm TSE, respectively.
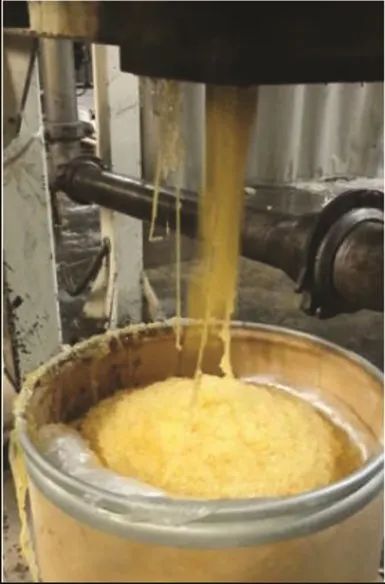
Figure 4 Solid polymer particles discharged through the diverter valve of the 92 mm TSE are collected in a waste bin.
Root cause analysis indicates that the low shear stress transmitted to the material is likely due to a lubricating effect caused by low viscosity of the raw material on the extruder barrel and screw. This phenomenon did not occur on the 26 mm TSE, and although there were slight signs of it on the 40 mm TSE (such as phase separation and poor mixing), the issue was successfully resolved at this scale through appropriate adjustments as described above.
It is noteworthy that as the size of the extruder increases, the area/volume (A/V) ratio of the heat exchanger (TSE) decreases sharply. This means that as the diameter increases, control over variables such as heat transfer becomes increasingly poor. The result of the analysis was a reassessment of screw design and feed configuration. After implementing these improvements, the SME increased from 0.026kWh/kg to 0.086kWh/kg.
Figures 5A and 5B show photographs of the discharged melt and pelletized masterbatch after implementing these improvements. Figure 5A displays a completely homogeneous melt, with neither phase separation nor unmelted pellets, while Figure 5B demonstrates that the process can produce pelletized masterbatch. Ultimately, this process is capable of achieving the corresponding economically feasible scale-up ratio (estimated using Equation 2), which is 12.17 times higher than that of the 40 mm TSE.
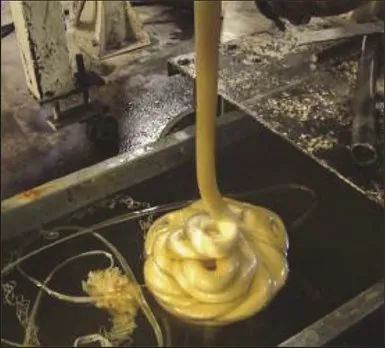

Figure 5A shows the fully homogeneous melt discharged through the 92 mm TSE die; Figure 5B shows the masterbatch pellets.
Conclusion
The scaling-up of the TSE process from laboratory scale to commercial scale involves multiple aspects.Although formulas may provide potential achievable rate indicators, other factors may hinder the scaling-up process. Therefore, an appropriate scale-up strategy should be determined/defined based on the analysis of as much process data as possible at each scale (unit operations and their sequence, boundary conditions, physical and chemical properties of raw materials, process limitations, etc.).
In this case study, the specific mechanical energy (SME) obtained from the laboratory-scale TSE is a key parameter and reference for subsequent scale-up production. Furthermore, the laboratory-scale compounding process did not exhibit any type of limitation (such as heat transfer, feeding, raw material fluidization, etc.); therefore, the power/volume method (Equation 2) was chosen for scale-up to larger extruders (40 mm and 92 mm TSE).
Despite encountering poor process instability and quality issues in the 40mm and 92mm scale pilot-scale upscaling,However, as long as subsequent process changes and adjustments at this scale match the SME obtained on the 26mm TSE, the process can achieve the desired masterbatch quality stability and reliability.
【Copyright and Disclaimer】The above information is collected and organized by PlastMatch. The copyright belongs to the original author. This article is reprinted for the purpose of providing more information, and it does not imply that PlastMatch endorses the views expressed in the article or guarantees its accuracy. If there are any errors in the source attribution or if your legitimate rights have been infringed, please contact us, and we will promptly correct or remove the content. If other media, websites, or individuals use the aforementioned content, they must clearly indicate the original source and origin of the work and assume legal responsibility on their own.
Most Popular
-

AI Computing Power Demand Ignites Electronic Fabrics! China Jushi Hits Limit Up! Domestic Substitution Welcomes Golden Window
-

Focus on going global! kingfa sci. leads, huitong, preter, and kumho nire follow, china’s modified plastics frenziedly expanding worldwide
-

Back-to-back major joker moves! covestro’s 1.32 million ton mdi dual-line expansion and hdi acquisition reshape global polyurethane landscape
-

Evonik Parts Ways With The Polyester Business! A Strategic Retreat By A Germany Chemical Giant And The Global Industry Shift
-

PA66 Cost and Profit: Broad-Based Weakness in the Feedstock Market Continues to Erode Cost Support for PA66 (202606)


