


Upstream and Downstream Siege: How Should the Recycled PE Industry Break the Deadlock
[Introduction]:"The price of recycled plastic has been rising again and again, but the renewable pellets are not selling!" The complaint from Lao Li, the head of a recycled plastic factory, reflects the common predicament in the current industry: high upstream raw material costs are a "choke point", while downstream market demand is weak and "unresponsive". Recycled plastic companies are caught in the middle, with profit margins compressed to the critical point. Behind this "upstream and downstream game" is the fierce clash of costs, demand, and policies, and the industry urgently needs to find a way to break the deadlock.
Sure, please provide the content you would like me to translate into English.Upstream "choke point": Expensive waste materials and chaotic supply make it difficult for enterprises to function without resources.
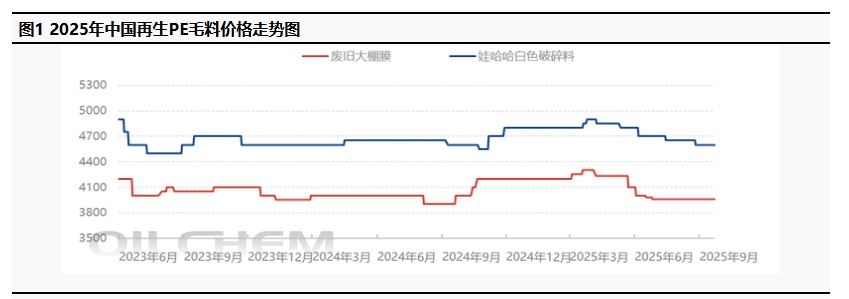
The raw material for recycled plastic is waste plastic, but in recent years, upstream issues have frequently occurred. Firstly, there is a sharp rise in recycling costs. Influenced by fluctuations in international oil prices and stricter environmental regulations, the recycling price of waste plastic has continued to increase. For example, the recycling price of waste PE film has directly risen from last year's average price of 4022.51 yuan/ton to the current price of 4107.34 yuan/ton, an increase of over 2%, directly driving up the cost of recycled materials.
Secondly, the quality of raw materials varies significantly. The domestic recycling system is fragmented, and small workshops mix impurities for profit, resulting in unstable performance of recycled materials, making it difficult to meet the needs of high-end manufacturing. According to the actual utilization rate of recycled products, the yield of products made from recycled plastics is 30% lower than that of products made from virgin materials, leading to an increased scrap rate and higher risks for enterprises.
The instability in the supply of recycled plastics has resurfaced, often caused by environmental inspections and the pandemic prior to 2024, leading to many recycling and packing stations being forced to shut down or close due to financial breakdowns. This has resulted in a shortage of waste materials in the market, prompting companies to scramble for supplies and further exacerbating the cost pressures on recycling enterprises.
Translate the above content into English, output the translation directly, and do not provide any explanation.Downstream "not buying it": competition from new materials, weak demand, loss of cost-effectiveness advantage for recycled materials.
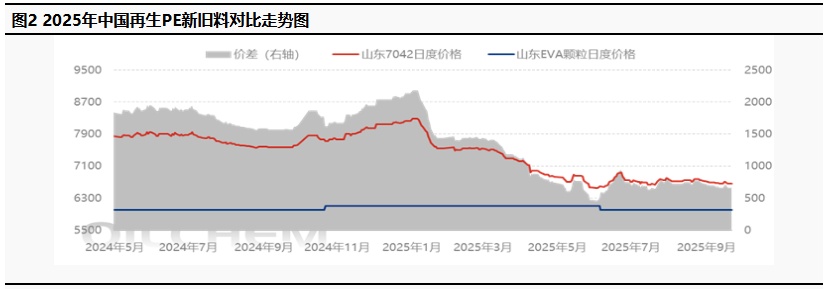
Since entering 2025, the price of new PE has continuously fluctuated downwards. Within the month, the price experienced slight fluctuations due to the Federal Reserve's interest rate cut, but the subsequent momentum was insufficient, causing prices to fall again. Coupled with the market remaining lukewarm and downstream replenishment efforts lacking, merchants offered slight concessions in actual transactions, making it difficult for trading to improve. This month, the price difference between new and recycled materials is below 700 yuan/ton, with the price difference between new and recycled materials long outside the reasonable range, causing the price advantage of recycled PE to gradually decline.
The seasonal fluctuations in orders have begun to weaken, and the demand during the traditional peak seasons (such as "Golden September and Silver October") has not met expectations. Affected by the broader environment, the overall production and sales rhythm of the industrial chain has weakened, resulting in lower consumer purchasing frequency and high inventory levels for downstream enterprises, leading to a lack of purchasing willingness.
3. The Double-Edged Sword of Policy: Benefits Yet to Arrive, Compliance Costs Rise First
1. Stricter environmental standards: New regulations require recycled plastic companies to be equipped with exhaust gas treatment equipment and establish a traceability system. Small and medium-sized factories are forced to shut down or relocate due to insufficient funds. According to statistics, more than 2,000 small recycled plastic workshops nationwide have been closed in the first half of 2023.
The barriers to export have been raised: The EU's Single-Use Plastics Directive requires a 30% recycled plastic content to enter the market. However, due to outdated technology, most domestic products fail to meet the standard, leading to a significant loss of export orders.
Subsidy implementation lags behind: Although the government has introduced policies such as tax incentives and green credit, the application process is complex and funding is slow to arrive, making it difficult for enterprises to alleviate financial pressure in the short term.
Four, the way to break the deadlock: a three-pronged approach of technology, models, and policies.
In the face of the above industry challenges, enterprises should make breakthroughs from the following directions:
1. Technological upgrades to reduce costs: In the past two years, chemical recycling technologies (such as pyrolysis and gasification) have been increasingly mentioned. These technologies convert low-value waste plastics into high-quality recycled materials, enhancing their added value.
2. Model innovation for stable supply: Leading companies can integrate resources through a "recycling network + digital platform" to achieve traceability and closed-loop utilization of waste plastics.
3. Policy coordination to expand the market: The government can implement mandatory quota systems (such as requiring packaging companies to use no less than 30% recycled materials) and simplify the subsidy application process to help companies overcome difficulties. Additionally, strengthening international certification cooperation can assist companies in overcoming export barriers.
The winter of the recycled PE industry is essentially a fierce clash between traditional models and green transformation. Companies that cling to low-end manufacturing will eventually be eliminated by the market; only by actively embracing technological change and exploring new business models can they seize the opportunity when policy dividends are released. As an industry expert has said, "The current growing pains are for a better future."
Although the road to breaking the deadlock is difficult, the dawn has already appeared. The recycled PE market will continue to operate cautiously for a long time. Longzhong Information estimates that this week the price of recycled PE in Hebei for high-pressure white transparent primary granules is around 6050 yuan/ton, EVA granules in Juxian are around 6000 yuan/ton, and white granules from Hebei Wahaha are around 5500 yuan/ton.
【Copyright and Disclaimer】The above information is collected and organized by PlastMatch. The copyright belongs to the original author. This article is reprinted for the purpose of providing more information, and it does not imply that PlastMatch endorses the views expressed in the article or guarantees its accuracy. If there are any errors in the source attribution or if your legitimate rights have been infringed, please contact us, and we will promptly correct or remove the content. If other media, websites, or individuals use the aforementioned content, they must clearly indicate the original source and origin of the work and assume legal responsibility on their own.
Most Popular
-

AI Computing Power Demand Ignites Electronic Fabrics! China Jushi Hits Limit Up! Domestic Substitution Welcomes Golden Window
-

Focus on going global! kingfa sci. leads, huitong, preter, and kumho nire follow, china’s modified plastics frenziedly expanding worldwide
-

Back-to-back major joker moves! covestro’s 1.32 million ton mdi dual-line expansion and hdi acquisition reshape global polyurethane landscape
-

Evonik Parts Ways With The Polyester Business! A Strategic Retreat By A Germany Chemical Giant And The Global Industry Shift
-

PA66 Cost and Profit: Broad-Based Weakness in the Feedstock Market Continues to Erode Cost Support for PA66 (202606)


