


Third Quarter Ocean Freight Rates Drop, But Polyolefin Export Market Remains Weak
Introduction:
Export freight rates:
As of the week ending September 26, the demand for China's export container shipping has weakened, ocean route market freight rates continued to adjust, and the composite index continued to decline.
The European route has seen weak economic data recently, leading to a lack of momentum in transportation market demand growth. This week, the supply and demand fundamentals are weak, and spot market booking prices continue to decline. On September 26, the freight rate (including sea freight and surcharges) from Shanghai Port to major European ports was $971/TEU, down 7.7% compared to the previous period. The Mediterranean route is similar to the European market, with freight rates continuing to adjust. On September 26, the freight rate (including sea freight and surcharges) from Shanghai Port to major Mediterranean ports was $1485/TEU, down 9.3% compared to the previous period.
The transportation demand on the Persian Gulf route remains weak, and spot market freight rates have undergone a significant adjustment, with a slightly smaller decline compared to the previous period. On September 26, the market freight rate (ocean freight and surcharges) from Shanghai Port to the main ports in the Persian Gulf was $843/TEU, a decrease of 14.9% compared to the previous period.
The South American shipping route is experiencing weak growth in the transportation market, with supply and demand maintaining a weak balance. Spot market booking prices continue to decline. As of September 26, the market freight rate (including shipping and surcharges) from Shanghai Port to major ports in South America is $2,133 per TEU, down 14.6% from the previous period.
Regarding the export prices of polyolefins:
LLDPE Export Price Trends at FOB Tianjin Port from July to September 2025
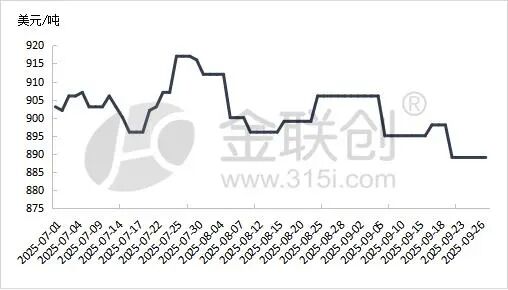
Data source: Jin Lian Chuang
FOB Tianjin Port PP export price trend from July to September 2025
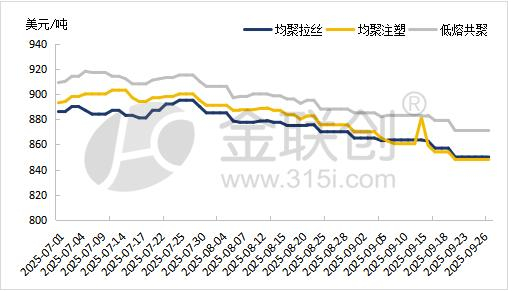
Data Source: JLC (Jinlianchuang)
In September, China's export container index saw a slight decline due to continuously falling domestic prices and a weak performance in the export market. Quotes decreased compared to August, with actual transactions experiencing discounts of varying amounts up to $10 per ton. The weakness in overseas markets has also intensified competition among exporters.
In the third quarter, although sea freight rates showed a downward trend, it did not improve the current situation of sluggish exports. Export prices continue to be adjusted downward due to weak demand and intensified competition, compressing export profits. It is still the seasonal off-peak period for exports, and exporters are still waiting for a possible window period in the fourth quarter.
【Copyright and Disclaimer】The above information is collected and organized by PlastMatch. The copyright belongs to the original author. This article is reprinted for the purpose of providing more information, and it does not imply that PlastMatch endorses the views expressed in the article or guarantees its accuracy. If there are any errors in the source attribution or if your legitimate rights have been infringed, please contact us, and we will promptly correct or remove the content. If other media, websites, or individuals use the aforementioned content, they must clearly indicate the original source and origin of the work and assume legal responsibility on their own.
Most Popular
-

AI Computing Power Demand Ignites Electronic Fabrics! China Jushi Hits Limit Up! Domestic Substitution Welcomes Golden Window
-

Focus on going global! kingfa sci. leads, huitong, preter, and kumho nire follow, china’s modified plastics frenziedly expanding worldwide
-

Back-to-back major joker moves! covestro’s 1.32 million ton mdi dual-line expansion and hdi acquisition reshape global polyurethane landscape
-

Evonik Parts Ways With The Polyester Business! A Strategic Retreat By A Germany Chemical Giant And The Global Industry Shift
-

PA66 Cost and Profit: Broad-Based Weakness in the Feedstock Market Continues to Erode Cost Support for PA66 (202606)


