


The Three Global Orthopedic Giants | Johnson & Johnson, Stryker, and Zimmer Biomet All Achieve Stable Growth in Their Latest 2024 Financial Reports
So far, the three giants of orthopedics have announced their 2024 performance, with Johnson & Johnson and Stryker both achieving sales of $9.1 billion, neck and neck, while Zimmer Biomet also reached $7.7 billion. Trauma products account for a high proportion, with Zimmer Biomet leading in knee joints. International orthopedic giants are responding to the challenges of centralized procurement, achieving stable growth.
So far, the three giants of orthopedics have announced their 2024 performance, with Johnson & Johnson and Stryker both achieving sales of $9.1 billion, neck and neck, while Zimmer Biomet also reached $7.7 billion. Trauma products account for a high proportion, with Zimmer Biomet leading in knee joints. International orthopedic giants are responding to the challenges of centralized procurement, achieving stable growth.
In January, Johnson & Johnson announced its 2024 performance, with total annual revenue of $88.821 billion, up from $85.159 billion last year, representing a 4.3% year-over-year increase. The full-year net profit was $14.066 billion, up from $13.326 billion last year, representing a 5.6% year-over-year increase. Johnson & Johnson's two core business segments - innovative pharmaceuticals and medical technology - achieved revenues of $56.964 billion (+4.0%) and $31.857 billion (+4.8%), respectively.
In January, Johnson & Johnson announced its 2024 performance, with total annual revenue of $88.821 billion, up from $85.159 billion last year, representing a 4.3% year-over-year increase. The full-year net profit was $14.066 billion, up from $13.326 billion last year, representing a 5.6% year-over-year increase. Johnson & Johnson's two core business segments - innovative pharmaceuticals and medical technology - achieved revenues of $56.964 billion (+4.0%) and $31.857 billion (+4.8%), respectively.Johnson & Johnson's Medical Technology segment achieved sales of $31.86 billion in 2024, an increase of 4.8%, with orthopedic business sales reaching $9.158 billion, accounting for 28.7%.
Johnson & Johnson's Medical Technology segment achieved sales of $31.86 billion in 2024, an increase of 4.8%, with orthopedic business sales reaching $9.158 billion, accounting for 28.7%.In orthopedic products, trauma-related items are the most numerous, with sales exceeding $3 billion, accounting for one-third of the total. This is followed by spine, sports, and other categories, which also account for nearly one-third of the total. In 2025, Johnson & Johnson is expected to see an increase of 2.5% to 3.5%, with total revenue projected to reach between $90.9 billion and $91.7 billion.
In 2025, Johnson & Johnson is expected to see an increase of 2.5% to 3.5%, with total revenue projected to reach between $90.9 billion and $91.7 billion.
Details of the Financial Report
Details of the Financial ReportNet sales for 2024 were $22.6 billion, with an organic growth in net sales of 10.2%;
Net sales for 2024 were $22.6 billion, with an organic growth in net sales of 10.2%;The operating profit margin was 16.3%. The adjusted operating profit margin increased by 110 bps to 25.3%;
The operating profit margin was 16.3%. The adjusted operating profit margin increased by 110 bps to 25.3%;The US and international markets both performed exceptionally well, with the US market continuing to show strong double-digit growth at 11%, and the international market also achieving a 9.8% growth at a fixed exchange rate.
The medical devices and neurotechnology business: net sales were $13.5 billion, with organic net sales growth of 11.2%.
Orthopedics business: net sales were $9.1 billion, with an organic net sales growth of 8.7%, accounting for 40% of the annual sales. Among orthopedic products, trauma and extremities were the highest, reaching $3.5 billion, accounting for nearly 40% of the orthopedics business, and the growth rate exceeded 11%. Knee and hip joints also achieved stable growth.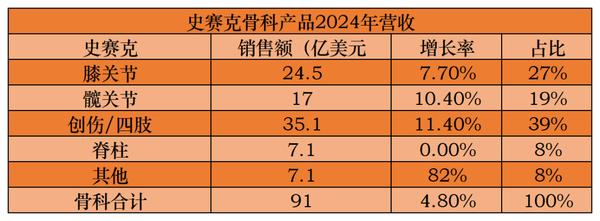 Data source: Pharmaceutical and Medical Device River Record
2025 Outlook
Based on the strong development momentum in 2024, Stryker estimates that the organic net sales growth rate for 2025 will be between 8.0% and 9.0%, with adjusted diluted net earnings per share expected to be between $13.45 and $13.70.
With the strong development momentum in 2024, Stryker estimates that the organic net sales growth rate for 2025 will be between 8.0% and 9.0%, with adjusted diluted net earnings per share expected to be $13.45 to $13.70.Stryker has completed its acquisition of Inari Medical, which is expected to contribute $590 million in sales in 2025.
Stryker has completed its acquisition of Inari Medical, which is expected to contribute $590 million in sales in 2025.
Zimmer Biomet Holdings announced its full-year 2024 results, with annual net sales of $7.679 billion, up from $7.394 billion the previous year. The full-year operating profit was $1.286 billion, compared to $1.278 billion the previous year. The full-year net income attributable to the company was $904 million, down from $1.024 billion the previous year.
Zimmer Biomet Holdings announced its full-year 2024 results, with annual net sales of $7.679 billion, up from $7.394 billion the previous year. The full-year operating profit was $1.286 billion, compared to $1.278 billion the previous year. The full-year net income attributable to the company was $904 million, down from $1.024 billion the previous year.The company achieved sales of $7.678 billion in 2024, a year-on-year increase of 3.8%, with the knee business being the largest, reaching $3.173 billion, accounting for 41% of the company's total sales.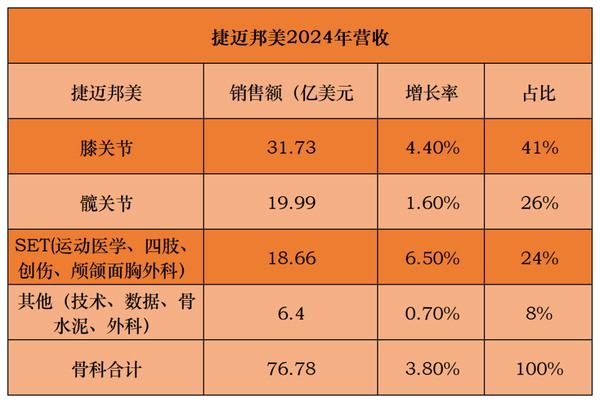
Knee: Zimmer Biomet had the highest sales at $3.173 billion, accounting for 41% of the company's total, Stryker at $2.45 billion, and Johnson & Johnson the least, at $1.545 billion.
Knee: Zimmer Biomet had the highest sales at $3.173 billion, accounting for 41% of the company's total, Stryker at $2.45 billion, and Johnson & Johnson the least, at $1.545 billion.Hip: Zimmer Biomet also led with $2 billion, while Johnson & Johnson and Stryker were not far apart, at $1.638 billion and $1.7 billion, respectively.
Hip: Zimmer Biomet also led with $2 billion, while Johnson & Johnson and Stryker were not far apart, at $1.638 billion and $1.7 billion, respectively.In other products, Stryker's trauma and extremities segment reached $3.51 billion, and Johnson & Johnson's trauma was the highest at $3 billion.
In other products, Stryker's trauma and extremities segment reached $3.51 billion, and Johnson & Johnson's trauma was the highest at $3 billion.The domestic orthopedic consumables centralized procurement has impacted the industry structure, but the three international orthopedic giants have achieved stable growth through various strategies.
The domestic orthopedic consumables centralized procurement has impacted the industry structure, but the three international orthopedic giants have achieved stable growth through various strategies.Zimmer Biomet is optimistic about its full-year financial performance for 2025 and provided the following guidance:
Zimmer Biomet is optimistic about its full-year financial performance for 2025 and provided the following guidance:1. Expected revenue growth: 1.0% to 3.5% as reported, and 3.0% to 5.0% on a constant currency basis.
1. Expected revenue growth: 1.0% to 3.5% as reported, and 3.0% to 5.0% on a constant currency basis.2. Adjusted diluted earnings per share: expected to be between $8.15 and $8.35.
2. Adjusted diluted earnings per share: expected to be between $8.15 and $8.35.【Copyright and Disclaimer】The above information is collected and organized by PlastMatch. The copyright belongs to the original author. This article is reprinted for the purpose of providing more information, and it does not imply that PlastMatch endorses the views expressed in the article or guarantees its accuracy. If there are any errors in the source attribution or if your legitimate rights have been infringed, please contact us, and we will promptly correct or remove the content. If other media, websites, or individuals use the aforementioned content, they must clearly indicate the original source and origin of the work and assume legal responsibility on their own.
Most Popular
-

AI Computing Power Demand Ignites Electronic Fabrics! China Jushi Hits Limit Up! Domestic Substitution Welcomes Golden Window
-

Focus on going global! kingfa sci. leads, huitong, preter, and kumho nire follow, china’s modified plastics frenziedly expanding worldwide
-

Back-to-back major joker moves! covestro’s 1.32 million ton mdi dual-line expansion and hdi acquisition reshape global polyurethane landscape
-

Evonik Parts Ways With The Polyester Business! A Strategic Retreat By A Germany Chemical Giant And The Global Industry Shift
-

PA66 Cost and Profit: Broad-Based Weakness in the Feedstock Market Continues to Erode Cost Support for PA66 (202606)


