


The performance of 57 companies in six major sectors, including steel, chemicals, petroleum and chemical fibers, rubber and plastics, will be released for 2024!
According to the performance data released in 2024 for the new materials industry, some listed companies have been statistically analyzed for their 2024 performance. The following are the performance details of enterprises in sub-sectors such as rubber and plastics, chemical raw materials and products, oil and chemical fibers, fertilizers and pesticides, non-ferrous metals, and steel.
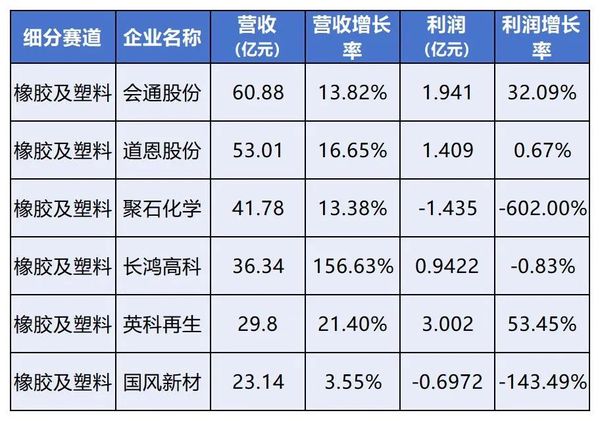
Rubber and Plastic
The performance of companies in the rubber and plastics industry shows a divergence. Companies like Huitong Co., Ltd. and Daon Co., Ltd. have achieved growth in both revenue and profit, demonstrating their competitiveness and risk resilience in the market. Although Jushi Chemical has seen revenue growth, it has incurred losses, possibly due to fluctuations in raw material prices or intensified market competition. Yingke Recycling has reported increases in both revenue and profit, while Guofeng New Materials has fallen into losses, reflecting the uneven development among enterprises in this industry.
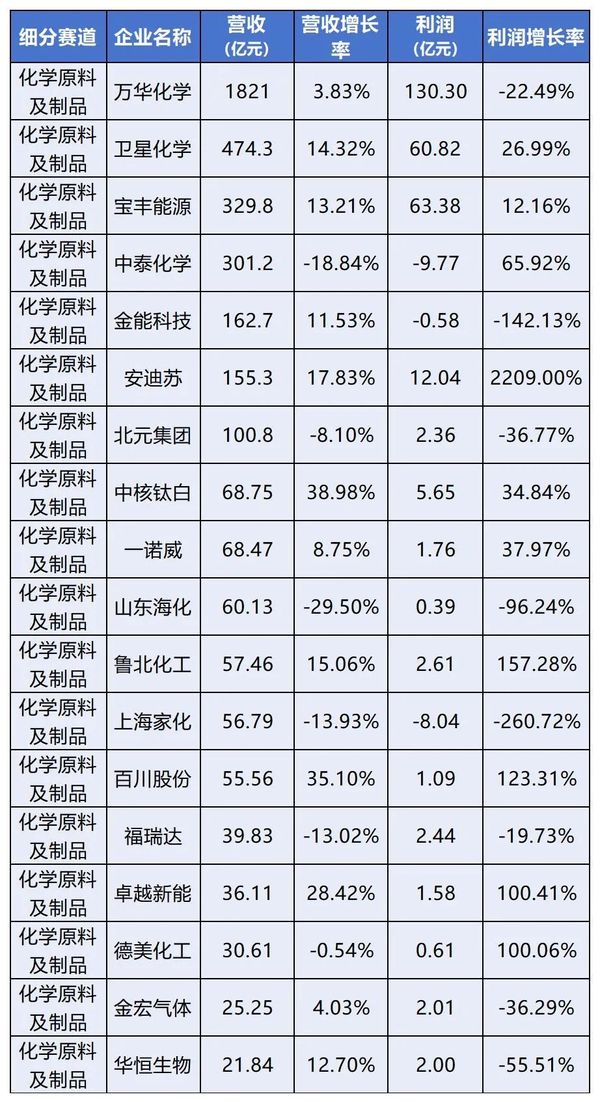
Chemical Raw Materials and Products
The performance of companies in the chemical raw materials and products industry has shown分化。Wanhua Chemical's revenue was 182.1 billion yuan, up 3.83% year-over-year, but profits fell by 22.49%. SATCHEM's revenue was 47.43 billion yuan, up 14.32% year-over-year, with profits increasing by 26.99%. Some companies achieved growth in their performance through optimization of product structures and cost control, while others saw a decline due to market conditions and the impact of raw material prices.
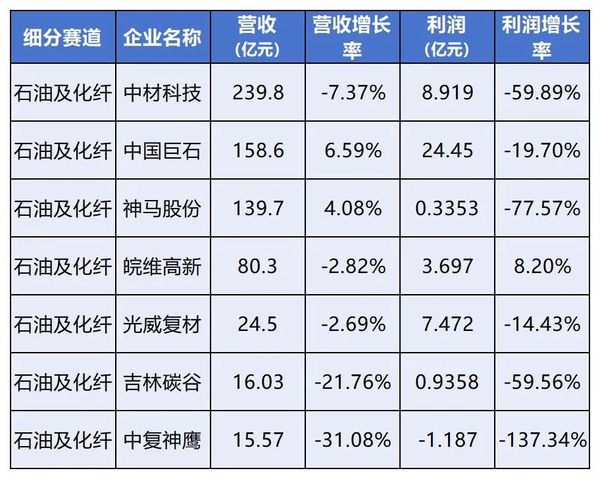
Petroleum and Chemical Fiber
The performance of companies in the petroleum and chemical fiber industry varies significantly. China National Materials Technology reported revenue of 23.98 billion yuan, a year-on-year decrease of 7.37%, with profits dropping by nearly 60%. China Jushi achieved revenue of 15.86 billion yuan, a year-on-year increase of 6.59%, but profits fell by 19.7%. Companies such as Shunma Co. and Anhui Wuwei High-tech are also facing profit declines or sluggish growth. Guangwei Composite and Jilin Carbon Valley reported declines in both revenue and profits, indicating that the industry is facing challenges in market competition and cost control.
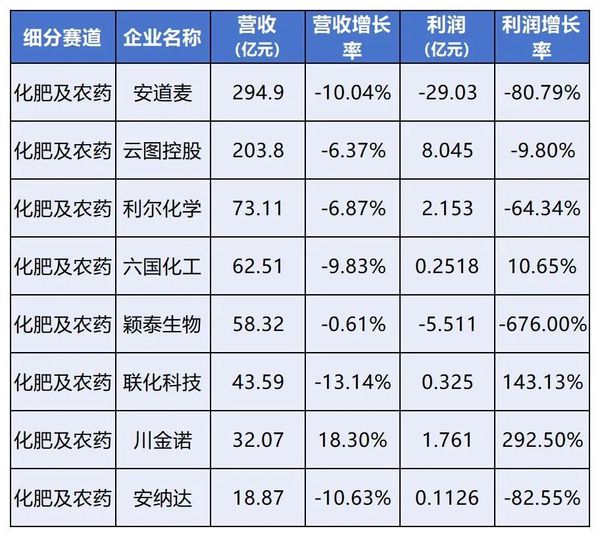
Fertilizers and pesticides
The performance of companies in the fertilizer and pesticide sectors has declined significantly. ADAMA's revenue was 29.49 billion yuan, a year-on-year decrease of 10.04%, with losses expanding. Companies like YunTu Holding and Lier Chemical also saw declines in both revenue and profits. However, a few companies such as Sixuan Chemical and Chuan Jinuo achieved growth in both revenue and profits. Amid the overall industry downturn, some companies managed to break through by adopting differentiated competition or cost advantages.
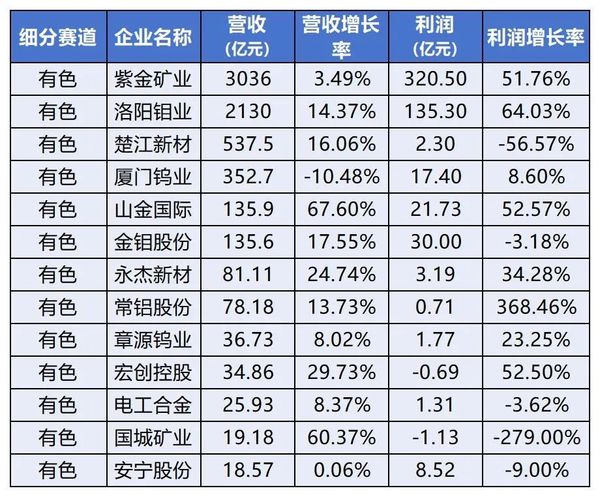
Colored
The performance of companies in the colored metal industry varies. Zijin Mining tops the list with a revenue of 303.6 billion yuan and a profit of 32.05 billion yuan, showing its leading position in the industry and strong profitability, with a revenue growth of 3.49% and a profit growth of 51.76%. Luoyang钼业's revenue reached 213 billion yuan, up 14.37% year-over-year, and its profit grew by 64.03%. Some companies have achieved stable growth through technological innovation and market expansion.
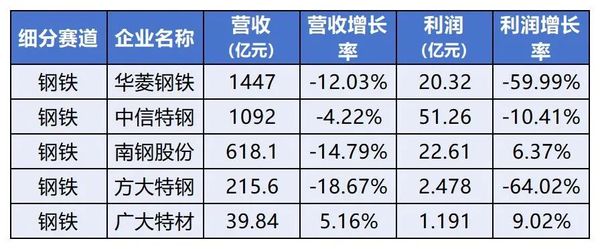
▲Steel
The steel industry is facing significant pressure overall. Hualing Steel ranks at the forefront with a revenue of 144.7 billion yuan, but its revenue has decreased by 12% year-on-year, and profits have also declined by nearly 60%. The steel market is gradually weakening on the demand side. Citic Special Steel reported a revenue of 109.2 billion yuan, a year-on-year decrease of 4.22%, with profits down by 10.41%. Nanjing Steel's revenue was 61.81 billion yuan, a year-on-year decrease of 14.79%, but profits increased by 6.37%, indicating that the company has made certain achievements in cost control or product structure optimization.
【Copyright and Disclaimer】The above information is collected and organized by PlastMatch. The copyright belongs to the original author. This article is reprinted for the purpose of providing more information, and it does not imply that PlastMatch endorses the views expressed in the article or guarantees its accuracy. If there are any errors in the source attribution or if your legitimate rights have been infringed, please contact us, and we will promptly correct or remove the content. If other media, websites, or individuals use the aforementioned content, they must clearly indicate the original source and origin of the work and assume legal responsibility on their own.
Most Popular
-

AI Computing Power Demand Ignites Electronic Fabrics! China Jushi Hits Limit Up! Domestic Substitution Welcomes Golden Window
-

Focus on going global! kingfa sci. leads, huitong, preter, and kumho nire follow, china’s modified plastics frenziedly expanding worldwide
-

Back-to-back major joker moves! covestro’s 1.32 million ton mdi dual-line expansion and hdi acquisition reshape global polyurethane landscape
-

Evonik Parts Ways With The Polyester Business! A Strategic Retreat By A Germany Chemical Giant And The Global Industry Shift
-

PA66 Cost and Profit: Broad-Based Weakness in the Feedstock Market Continues to Erode Cost Support for PA66 (202606)


