


The Competitive Cooperation of Two Giants: The Impact of Dow and Exxon on Global PE Production Capacity Restructuring in 2025
Introduction:
The dual capacity shockwave from ExxonMobil’s Huizhou ethylene project and Dow Chemical’s North American facilities is sweeping across the globe, quietly tipping the balance of the polyethylene market. This industrial transformation, centered on South China and the U.S. Gulf Coast, will not only rewrite the physical trade routes between Southeast Asia and North America but also reshape the price formation mechanisms of chemical products worth trillions of dollars.
Exxon and Dow's 2025 New Production Capacity Overview
Dow’s newly commissioned LLDPE production line in Freeport, Texas, USA, has begun operations. With an annual capacity of 600,000 tons, it is the only planned new PE capacity addition in North America this year. Dow recently announced positive developments in its new polyethylene unit in Texas. The increased polyethylene output is not only aimed at strengthening the company’s position in sectors such as health, hygiene, and specialty packaging, but also expands its overall production capacity. This has also had a positive impact on ethylene prices along the U.S. Gulf Coast.
Meanwhile, in the first half of 2025, ExxonMobil's Dayawan project began LLDPE production in April, and in July, it officially announced the successful commissioning of the ExxonMobil Huizhou complex project. This marks another significant milestone in ExxonMobil's commitment to maintaining manufacturing and technological leadership globally.
Changes in Dow Chemical's North American PE Capacity Share from 2024 to 2025
Unit: ten thousand tons/year
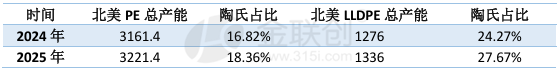
Data source: Jinlianchuang
In 2024, Dow Chemical's total PE production capacity is 5.316 million tons per year, with LLDPE capacity at 3.097 million tons per year. The total PE production capacity in North America in 2024 is 31.614 million tons per year, and the total LLDPE capacity in North America is 12.76 million tons per year. Dow Chemical's LLDPE facility, as the only new plant to be commissioned in North America in 2025, has increased the region's total production capacity and raised Dow Chemical's share of polyethylene capacity in North America.
As another chemical giant in North America, ExxonMobil's PE production capacity in the North American region is currently 6.306 million tons per year, accounting for 19.58% of the region. Its LLDPE production capacity is 4.315 million tons per year, accounting for 32.3% of the region. Exxon has a relatively significant advantage in PE supply in North America.
ExxonMobil's new PE unit in China in 2025
Unit: 10,000 tons/year
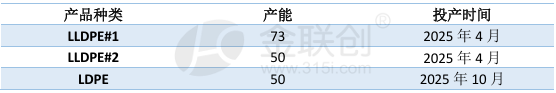
Data source: JLC Network Technology
As of now, ExxonMobil Huizhou has already put two LLDPE production lines into operation. This year, the LLDPE #1 line mainly produces linear products, while the other line focuses on producing metallocene. It is reported that the 730,000 tons/year production line is also planned to start producing metallocene next year. If both lines operate at full capacity for metallocene products, they can basically cover the metallocene import volume of the importer. The importation of linear metallocene and C8/C6 linear products has a profound impact on the structure of LLDPE imports in China.
Post-Capacity Transformation Projection of China's LLDPE Import Pattern
In June 2025, PE imports amounted to 959,300 tons, falling to the lowest level in three years. PE imports for the first half of this year have consistently remained below the five-year average.
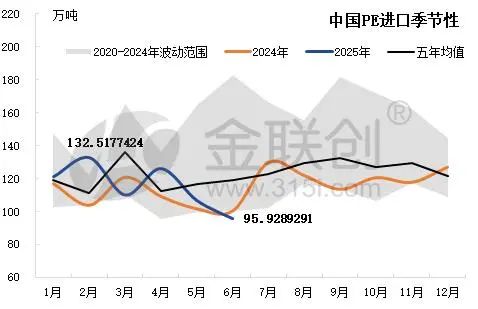
Data Source: General Administration of Customs, JLC Industry Research Group
In June 2025, the import volume of LLDPE decreased by 0.73 thousand tons compared to May, marking the lowest value for the first half of the year. The import volume of LDPE decreased by 5.09 thousand tons compared to May, also marking the lowest value for the first half of the year. The import volume of HDPE decreased by 5.07 thousand tons compared to May, similarly marking the lowest value for the first half of the year.
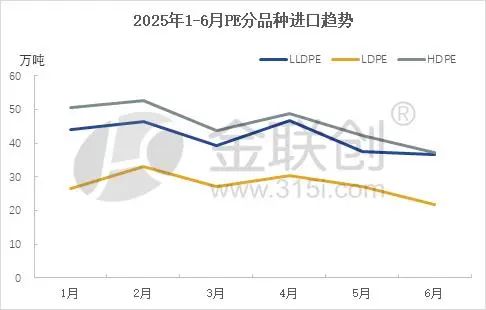
Data sources: General Administration of Customs, JLC Network
The main countries/regions importing LLDPE are Saudi Arabia, Singapore, Canada, Thailand, and the United States. Among LLDPE products, linear metallocene, C6 linear, and C8 linear together account for a relatively high proportion of imports, estimated to be around 50% in total based on import data. Among the producers of linear metallocene, C6 linear, and C8 linear, Dow Chemical and ExxonMobil are the leading manufacturers. They hold an important position in China's LLDPE import volume. ExxonMobil's imported products are mainly linear metallocene. It is expected that after the full production of metallocene by Exxon's two linear units in Huizhou in 2026, China’s LLDPE import volume will experience a second significant sharp decline.
Exxon and Dow's main production of metallocene market prices are under pressure.
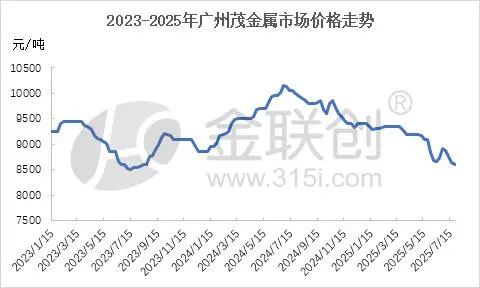
Data source: JLC (Jinlianchuang)
In 2025, domestic PE prices are expected to remain weak, with metallocene market prices continuing to follow the downward trend. In the Chinese domestic market, lackluster downstream demand combined with the release of new domestic production capacity has resulted in a lack of upward momentum for the market. Additionally, the commissioning of ExxonMobil and domestic units has led to oversupply, causing metallocene market prices to continue declining.
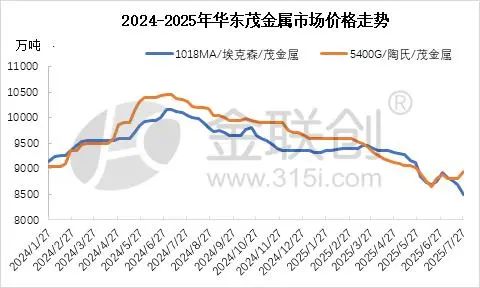
Data source: Jinlianchuang
The metallocene products of Exxon and Dow Chemical have shown basically the same trend. In July, Dow Chemical presold forward supplies, resulting in limited supply pressure and stronger price resistance to declines. In the future, the price of metallocene will still be mainly influenced by fundamental supply and demand factors. With the increase in production capacity by major suppliers Exxon and Dow Chemical, it is expected that the momentum for sustained price increases will be limited.
Supply Chain Strategy in Capacity Restructuring
Dow Chemical has a rich product portfolio and has also been working in the high-end application product field. It is expected to increase production capacity and improve the product configuration line in the future. ExxonMobil, with its large scale, offers stable supply and is a leader in the industrial grade and agricultural film sectors.
Before 2025, Exxon’s PE products exported to China mainly originated from the United States and Singapore, while Dow’s were primarily from Thailand and the United States. After 2025, the sources of China’s imports will gradually change. The Chinese market will rely on the domestic Huizhou plant as a base to serve various consumer regions across China. Exxon’s PE import volume will gradually decrease. Singaporean products will shift to supplying mainly Southeast and South Asia. Dow Chemical’s Thai plant is reportedly going to focus more on the production of high-end plastics, such as POE, in the future. China will mainly import products from Canada and Thailand. This is closely related to the escalation of trade disputes initiated by the United States this year; importing from Canada can effectively avoid tariffs.
In the future, with the restructuring of the supply chain in North America, the return of manufacturing, and the assessment of consumption potential expected to rise, the main growth of global packaging consumption was previously in North America, which also became a major motivation for Dow Chemical to increase its capacity in North America. According to market insiders, Exxon and Dow Chemical still have plans to increase their capacity in North America over the next three years, but these plans have not been officially announced.
After 2025, the flow of polyethylene (PE) in Southeast Asia and North America will experience an export substitution effect and changes in regional supply sources, marked by the commissioning of major facilities by Exxon and Dow Chemical. This will open a new chapter in the global capacity supply landscape.
【Copyright and Disclaimer】The above information is collected and organized by PlastMatch. The copyright belongs to the original author. This article is reprinted for the purpose of providing more information, and it does not imply that PlastMatch endorses the views expressed in the article or guarantees its accuracy. If there are any errors in the source attribution or if your legitimate rights have been infringed, please contact us, and we will promptly correct or remove the content. If other media, websites, or individuals use the aforementioned content, they must clearly indicate the original source and origin of the work and assume legal responsibility on their own.
Most Popular
-

AI Computing Power Demand Ignites Electronic Fabrics! China Jushi Hits Limit Up! Domestic Substitution Welcomes Golden Window
-

Focus on going global! kingfa sci. leads, huitong, preter, and kumho nire follow, china’s modified plastics frenziedly expanding worldwide
-

Back-to-back major joker moves! covestro’s 1.32 million ton mdi dual-line expansion and hdi acquisition reshape global polyurethane landscape
-

Evonik Parts Ways With The Polyester Business! A Strategic Retreat By A Germany Chemical Giant And The Global Industry Shift
-

PA66 Cost and Profit: Broad-Based Weakness in the Feedstock Market Continues to Erode Cost Support for PA66 (202606)


