


Supply Flood Peak Under ABS Winter: Prices Hit Bottom, Where To Go From Here?
Since September 2025, the domestic ABS resin market has deviated from the usual "golden September and silver October" peak season expectations, falling into a deep adjustment led by the supply side. With the concentrated release of new production capacity, persistently high inventory levels, collapsing cost support, and weak demand, market prices have been on a downward trajectory, and the industry is undergoing a severe test. This article will delve into the core contradictions in the current market and explore possible future development paths.
I. Supply Flood Peak: Historical Highs and Core Contradictions Under Capacity Expansion
The core contradiction in the current ABS market undoubtedly points to the rapid expansion of supply. Since the beginning of the third quarter of 2025, a wave of concentrated new capacity has swept the market. The commissioning of two sets of 600,000 tons of equipment by Shandong Yulong, a 200,000-ton facility by Daqing Petrochemical, and a 225,000-ton facility by Shandong Yike has pushed the total domestic ABS production capacity to exceed 10 million tons, reaching 10.49 million tons. The swift conversion of this massive new capacity into output has driven weekly production to break through the historic threshold of 140,000 tons, with market estimates predicting that total production in October will exceed 600,000 tons, also setting a new historical high.
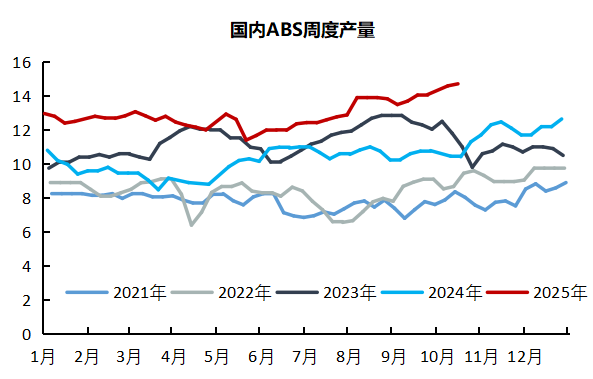
Despite routine maintenance being carried out on some old units during this period, the overall supply has increased rather than decreased due to the high-load operation of new units and the strategy of mainstream producers to maintain high operating rates to capture market share. This capital-driven capacity race has directly led to a complete reversal of the market supply-demand balance, with oversupply becoming the "Sword of Damocles" that suppresses the market, and this pressure is expected to further intensify in the future.
II. High Inventory: A Direct Reflection of Supply and Demand Imbalance and a Vicious Cycle
Accompanying the peak supply surge is the continuous rise and high accumulation of inventory. Since mid-June, ABS social inventory has begun an upward trajectory. Although there have been brief fluctuations during this period, the overall inventory level has remained significantly higher than the same period in history. As of after the National Day holiday, the total inventory has exceeded 250,000 tons, consistently staying above the high level of 200,000 tons for an extended period.
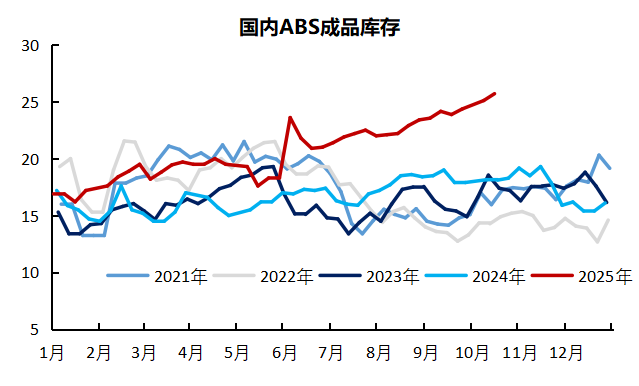
High inventory is not only a direct reflection of a serious imbalance between supply and demand but also profoundly affects the mindset and behavior of market participants. In the face of significant inventory pressure, manufacturers and traders commonly adopt price-cutting promotional strategies to alleviate capital occupation and storage costs in order to accelerate sales. However, this individual rational behavior forms a negative cycle at the collective level: "price reduction—intensified market bearish sentiment—downstream wait-and-see, demand postponement—inventory destocking difficulties—further price reductions," which continuously suppresses market prices, making the process of finding the bottom for prices exceptionally challenging.
III. Cost Collapse: Downward Linkage of the Raw Material Chain and Weakening Support
The cost support for ABS mainly comes from the three major raw materials: styrene, acrylonitrile, and butadiene. Unfortunately, during the "golden September and silver October" period, this raw material chain also performed weakly, resulting in a "collapsing" drag on the cost side.
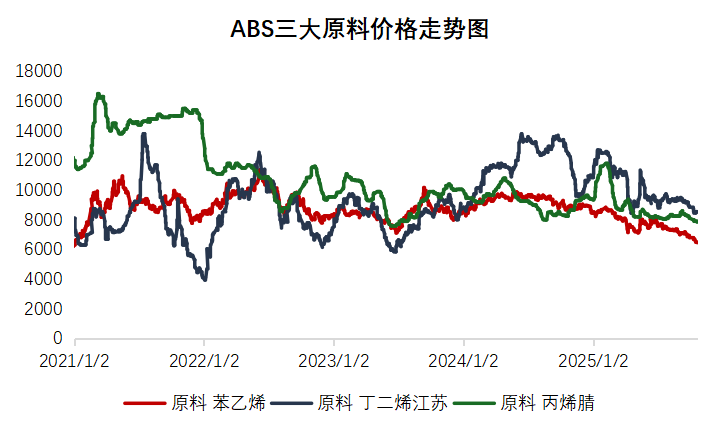
Among these, the weakness in styrene is particularly prominent. Its futures prices have been declining continuously since the end of September, hitting a nearly five-year low on October 16th. This is due to the significant drop in international crude oil prices (as geopolitical risk premiums dissipate and concerns about global oversupply rise) and the weak fundamentals of styrene itself—port inventories have climbed to a five-year high of nearly 200,000 tons. As an upstream product, the demand for pure benzene is also increasingly expected to peak. The butadiene and acrylonitrile markets are similarly facing considerable supply pressure. Overall, the bearish factors on the cost side are abundant, significantly weakening the support for the ABS market and even becoming a major force driving its prices downward.
Weak Demand: A Double Blow from Policy Withdrawal and External Constraints
The demand side's inability to absorb the massive supply is another key factor in the market's downturn. Weak demand stems from a combination of internal and external factors.
Excessive domestic demand and weakened policy effects.The national subsidy policy from the fourth quarter of 2024 to the first half of 2025, along with the "export rush" trend, had prematurely tapped into the demand in downstream sectors such as home appliances. By 2025, the subsidy policy shifted to a "phased release and flow control" approach, significantly weakening its stimulating effect. Market data clearly reflects this change: according to data from AVC, online retail sales of home appliances in September dropped by 16.0% year-on-year, while offline sales plummeted by 23.5%, with all seven major categories, including color TVs and air conditioners, underperforming. On the production side, caution prevailed, as industry online data showed that the total production volume of air conditioners, refrigerators, and washing machines in October decreased by 9.9% year-on-year.
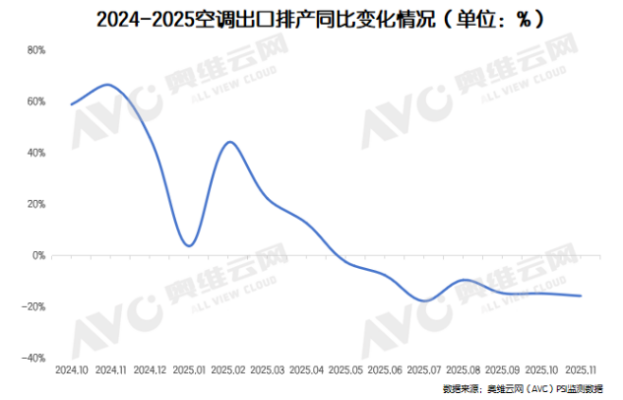
External demand faces the threat of high tariffs.Regarding exports, the United States plans to impose a 100% tariff on some Chinese goods starting November 1. Although this has not been fully implemented yet, the uncertainty has already severely disrupted the export rhythm. From September to November, the scheduled production for air conditioner exports decreased by 7.89% to 16.69% year-on-year. Meanwhile, overseas markets are also in a period of digesting high inventory levels, and importers' willingness to restock is low.
5. Conclusion
Looking ahead, it is extremely difficult for the ABS market to achieve a turnaround in the short term.
Short-term weakness is unlikely to change: On the supply side, the inertia of new capacity releases and high operating rates will maintain a high supply level, making the destocking process inevitably long and painful. On the demand side, domestic demand is constrained by policy rollbacks and a sluggish real estate market, while external demand is suppressed by trade frictions and a high base, making a strong rebound unlikely. Although raw materials such as styrene may experience temporary rebounds due to temporary reductions in operating rates, the expectation of inventory buildup in the medium term will continue to suppress their price space. Therefore, ABS prices are expected to remain weak in the next one to two quarters, with bottom oscillation being the main theme.
Author: Zhao Hongyan, Expert in Market Research at Zhuangsu Shijie

【Copyright and Disclaimer】This article is the property of PlastMatch. For business cooperation, media interviews, article reprints, or suggestions, please call the PlastMatch customer service hotline at +86-18030158354 or via email at service@zhuansushijie.com. The information and data provided by PlastMatch are for reference only and do not constitute direct advice for client decision-making. Any decisions made by clients based on such information and data, and all resulting direct or indirect losses and legal consequences, shall be borne by the clients themselves and are unrelated to PlastMatch. Unauthorized reprinting is strictly prohibited.
Most Popular
-

AI Computing Power Demand Ignites Electronic Fabrics! China Jushi Hits Limit Up! Domestic Substitution Welcomes Golden Window
-

Focus on going global! kingfa sci. leads, huitong, preter, and kumho nire follow, china’s modified plastics frenziedly expanding worldwide
-

Back-to-back major joker moves! covestro’s 1.32 million ton mdi dual-line expansion and hdi acquisition reshape global polyurethane landscape
-

Evonik Parts Ways With The Polyester Business! A Strategic Retreat By A Germany Chemical Giant And The Global Industry Shift
-

PA66 Cost and Profit: Broad-Based Weakness in the Feedstock Market Continues to Erode Cost Support for PA66 (202606)


