


Supply and Demand Boost: LDPE Market Rises Amid Fluctuations
[Introduction] Recently, with the major maintenance of LDPE at Guoneng Xinjiang, supply has decreased and prices have risen. In September, LDPE import volume is expected to continue its downward trend, while the peak demand season approaches and downstream operating rates increase significantly. With both supply and demand improving, domestic LDPE prices are expected to continue fluctuating upward in September. 。
1 Supply benefits support price base upward shift
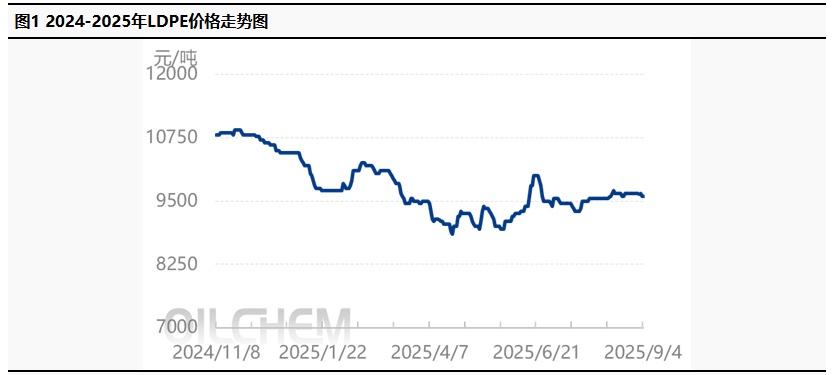
From the trend chart, starting in August, the LDPE price base shifted upward, with the monthly average price increasing by 1.29% month-on-month. In August, the Guoneng Xinjiang plant underwent a major maintenance, leading to tight supply of high-pressure film-grade material and a month-on-month decline in supply. On the demand side, the operating rates of agricultural film and packaging film gradually increased, procurement activities grew, and downstream raw material inventories rose. From a macro perspective, news of capacity reduction and other factors boosted market sentiment, keeping LDPE prices at a high level.
2 Imports and inventories both decline, strengthening price support.
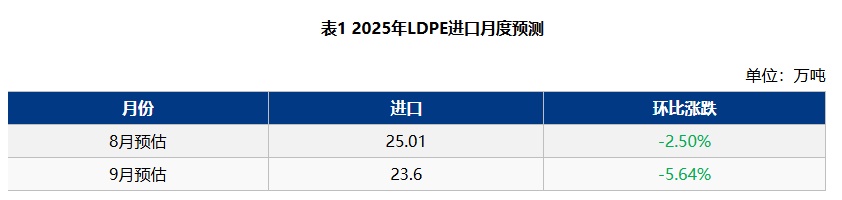
2025 In August, China's LDPE import volume is expected to be around 250,100 tons, a month-on-month decrease of 2.5%. In September 2025, China's LDPE import volume is expected to be around 236,000 tons, a month-on-month decrease of 5.64%. The main basis for this judgment is that the previous overseas market offer prices were relatively high, market confidence in the future is insufficient, the number of buyers has decreased, and coupled with fewer shipping delays in August, imports are expected to mainly decline.
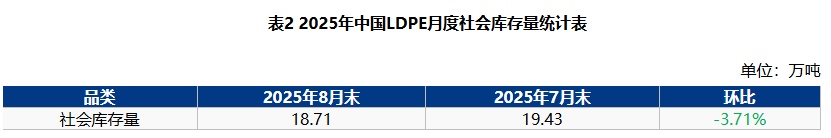
8 In the domestic LDPE market this month, circulating supply is relatively tight, and overall supply pressure is not significant. Operating rates in downstream industries have slightly increased, with replenishment mainly driven by rigid demand, leading to a downward trend in social inventory. In August, the social inventory of LDPE was 187,100 tons, a month-on-month decrease of 3.71%. In September, the social inventory of LDPE is expected to be 175,000 tons, a month-on-month decrease of 6.47%.
3. The peak demand season is approaching, and downstream operations are gradually increasing.
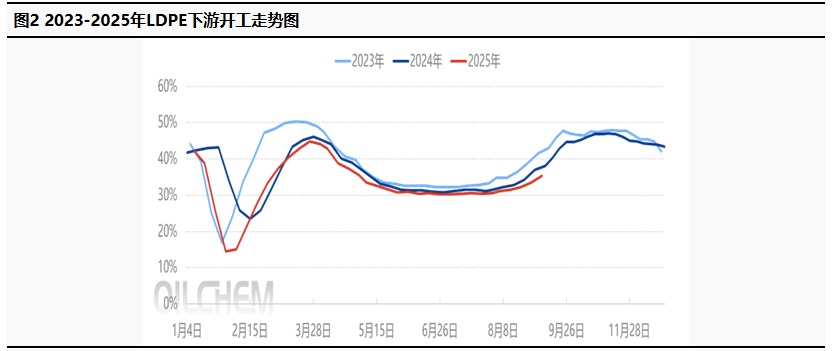
8 The monthly average operating rate of the PE packaging film industry is 49.4%, an increase of 1% compared to the previous month. The improvement in operating rates at terminal enterprises is mainly due to the consumption of accumulated orders from earlier periods, leading to a phase-based increase in production concentration. The monthly average operating rate for agricultural film is 14.7%, up by 2.2% month-on-month. In the greenhouse film market, only a few large-scale enterprises in the northern region have seen slight order follow-up, while most companies continue to focus on phased production.
9 The average monthly operating rate of the packaging film is expected to be 52.8%, an increase of 3.4% month-on-month. With the arrival of the "Golden September," market sentiment is expected to improve significantly, and the Mid-Autumn Festival and National Day holidays will drive terminal consumption. Large-scale enterprises are following up with new long-term agreements, leading to improved transactions. The average monthly operating rate of agricultural film is expected to be 33%, an increase of 18.3% month-on-month. The demand for greenhouse film in the northern regions is expected to increase significantly, and orders for large-scale enterprises are likely to rise sharply, which will drive the operating rate higher.
4 Dual Support from Supply and Demand Drives LDPE Market to Fluctuate Upward
Overall, on the supply side: the import volume in September is expected to decrease by 5.64% month-on-month, so the overall supply-side pressure is not significant. In terms of inventory, the social inventory of LDPE in September is expected to decrease by 6.47% month-on-month. On the demand side, with the arrival of peak demand season, downstream operating rates have risen significantly, with agricultural film operating rates up 18.3% month-on-month and packaging film operating rates up 3.4% month-on-month. In summary, with both supply and demand providing support, domestic LDPE prices are expected to continue to fluctuate upward in September.
【Copyright and Disclaimer】The above information is collected and organized by PlastMatch. The copyright belongs to the original author. This article is reprinted for the purpose of providing more information, and it does not imply that PlastMatch endorses the views expressed in the article or guarantees its accuracy. If there are any errors in the source attribution or if your legitimate rights have been infringed, please contact us, and we will promptly correct or remove the content. If other media, websites, or individuals use the aforementioned content, they must clearly indicate the original source and origin of the work and assume legal responsibility on their own.
Most Popular
-

AI Computing Power Demand Ignites Electronic Fabrics! China Jushi Hits Limit Up! Domestic Substitution Welcomes Golden Window
-

Focus on going global! kingfa sci. leads, huitong, preter, and kumho nire follow, china’s modified plastics frenziedly expanding worldwide
-

PA66 Cost and Profit: Broad-Based Weakness in the Feedstock Market Continues to Erode Cost Support for PA66 (202606)
-

Back-to-back major joker moves! covestro’s 1.32 million ton mdi dual-line expansion and hdi acquisition reshape global polyurethane landscape
-

Evonik Parts Ways With The Polyester Business! A Strategic Retreat By A Germany Chemical Giant And The Global Industry Shift


