


Still Struggling for Profit as Industry’s No. 3, Flashback Technology Seeks Lifeline in Hong Kong
Recently, Flashback Technology, a consumer electronics recycling service provider, has resubmitted its prospectus to the Hong Kong Stock Exchange, intending to be listed on the Main Board of the Hong Kong Stock Exchange.
Flashback Technology submitted its prospectus to the Hong Kong Stock Exchange twice, in February 2024 and September 2024. However, due to its failure to complete the hearing and listing process within six months, the prospectus became invalid and could no longer be used as a basis for review. The reasons for Flashback Technology's failed attempt to list on the Hong Kong stock market are attributed to a combination of factors, including continuous losses, rising debts, and pressure from performance guarantee agreements.
According to Frost & Sullivan, in terms of total transaction value of mobile device recovery in 2024, Flashback Technology is the third-largest mobile recycling service provider, with a transaction value of 1 billion yuan and a market share of approximately 1.3%. However, it is worth noting that despite ranking third in the industry, Flashback Technology's market share is significantly smaller than that of the top two companies (Aihuishou and Zhuanzhuan). In 2024, Aihuishou and Zhuanzhuan had transaction values of 6.2 billion yuan and 5.8 billion yuan, with market shares of 7.9% and 7.4%, respectively.
Currently, Flashback Technology's business primarily revolves around two major brands: Flashback Recycling and Flashback Premium. The former is the main brand for conducting offline recycling business and collecting second-hand consumer electronics from individual consumers through upstream procurement partners, while the latter is the main brand for selling the procured second-hand consumer electronics to customers through its own online platform and self-owned online stores on third-party e-commerce platforms.
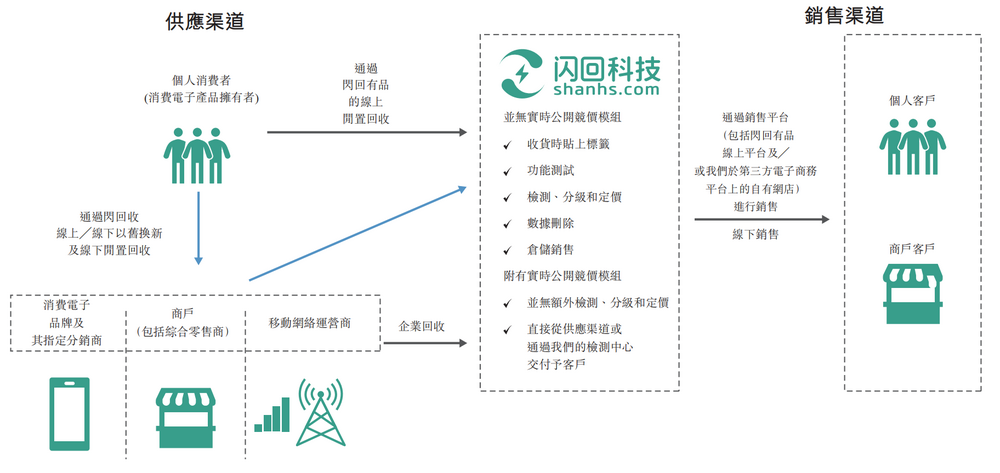
Source of image: Flashback Technology prospectus
In recent years, although Flashback Technology has maintained rapid revenue growth, it has yet to achieve profitability. The company’s business model inherently entails a high degree of dependence on upstream procurement partners, resulting in weak bargaining power. In addition, Flashback Technology relies heavily on its own online sales channels, while expansion into offline and third-party sales channels has been relatively slow. Faced with these unresolved challenges, the company’s path to going public remains full of uncertainty.
1. Difficult to Conceal Loss Dilemma
According to the prospectus, the revenues of Flashback Technology from 2021 to 2024 were 750 million yuan, 919 million yuan, 1.158 billion yuan, and 1.297 billion yuan, respectively; the net losses were 48.708 million yuan, 99.084 million yuan, 98.268 million yuan, and 66.443 million yuan, respectively. In the first half of 2025, Flashback Technology's revenue continued to grow, increasing by 40.33% year-on-year to 809 million yuan, with a net loss of 24.633 million yuan. Over the four and a half years, the cumulative loss of Flashback Technology reached as high as 337 million yuan, indicating the severity of the loss issue cannot be ignored.
The main reason for Flashback Technology's continued losses points to the persistently high sales costs. From 2021 to 2024, Flashback Technology's sales costs soared from 688 million yuan to 1.235 billion yuan, an increase of nearly 100%. In the first half of 2025, sales costs increased by 37.74% year-on-year to 759 million yuan, with the year-on-year growth rate on par with the revenue growth rate. The sales expense ratio has consistently remained above 93%.
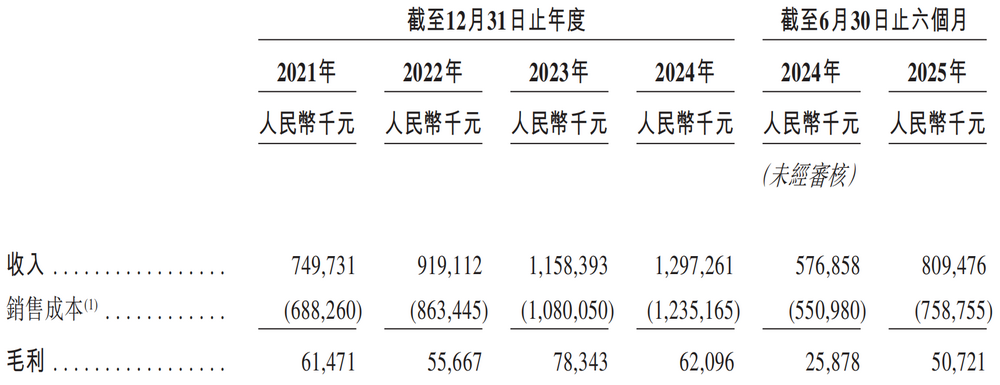
Source: Flashback Technology Prospectus
Flashback Technology employs an integrated operation model of "recycling-detection-processing-sales," requiring substantial investment in building digital infrastructure such as detection and operation centers. This asset-heavy operation model directly increases Flashback Technology's sales costs. Meanwhile, as the scale of Flashback Technology's business continues to expand, procurement costs, promotional services and commission expenses, logistics costs, and other fees are also continuously climbing, eroding its profit margins. Additionally, consumer electronics brands are launching their own recycling platforms, directly competing with Flashback Technology. Coupled with increasingly fierce market competition, Flashback Technology has to raise recycling prices to maintain supply, leading to a significant rise in sales costs.
The high sales costs have significantly constrained the gross profit margin. From 2021 to 2024 and the first half of 2025, the gross profit margins of Flashback Technology were 8.2%, 6.1%, 6.8%, 4.8%, and 6.3%, respectively, remaining at a relatively low level within the industry for a long time. In comparison, the gross profit margins of Aihuishou from 2021 to 2024 were 26.3%, 23.0%, 20.3%, and 19.9%, respectively, showing a significant gap between the two.
Low gross profit margins not only indicate that Flashback Technology is facing significant challenges in cost control but also mean that its profitability is greatly weakened. Over time, this will severely restrict business expansion and transformation, making it difficult for the company to break free from the dilemma of "increasing revenue without increasing profits."
2. Facing Multiple Challenges
In addition to continuous losses, Flashback Technology also faces numerous challenges.
First of all, Flashback Technology is highly dependent on upstream procurement partners. Its business model involves collaborating with upstream procurement partners—primarily major mobile phone brands, telecom operators, and large merchants—to acquire used consumer electronics at low prices through trade-in programs. After refurbishment, these products are resold to downstream customers.
From 2021 to 2024 and the first half of 2025, Flashback Technology procured approximately 1.033 million, 1.173 million, 1.505 million, 1.286 million, and 741,000 second-hand consumer electronic products (mainly mobile phones) through upstream procurement partner channels using the "trade-in" method. The total procurement amounts were approximately RMB 538 million, RMB 659 million, RMB 839 million, RMB 1.036 billion, and RMB 585 million, accounting for 78.2%, 76.4%, 77.7%, 83.9%, and 77.1% of the cost of sales, respectively. It can be seen that to support business scale expansion, Flashback Technology must continuously increase procurement; however, the high proportion of procurement costs has led to the cost of sales and gross profit margin remaining in a "high-risk state."
Meanwhile, Flashback Technology also relies on a single upstream procurement partner. According to the prospectus, Upstream Procurement Partner A (suspected to be Xiaomi Group) has always been Flashback Technology’s largest supplier. From 2021 to 2024 and the first half of 2025, the proportion of its total procurement amount for second-hand consumer electronic products purchased from Partner A through the "trade-in" model accounted for 45.2%, 44.7%, 29.1%, 44.8%, and 49.3%, respectively.
Highly relying on upstream procurement partners is tantamount to planting a “time bomb” in Flashback Technology’s performance. Once these upstream partners reduce supply due to market downturns, strategic adjustments, or their own operational problems, Flashback Technology’s performance will suffer a huge blow. In addition, in the recycling chain of second-hand consumer electronics products, upstream procurement partners usually hold a dominant position, resulting in Flashback Technology’s weak bargaining power and difficulty in effectively controlling procurement costs. Fluctuations in procurement costs may further erode gross margins and severely squeeze profit space. For Flashback Technology, which has not yet turned a profit, this is nothing short of adding insult to injury.
Secondly, the sales channel structure is overly concentrated. Flashback Technology relies heavily on its self-owned online sales channel, Flashback Youpin. From 2021 to 2024 and the first half of 2025, the revenue contributed by Flashback Youpin accounted for 85.6%, 87.2%, 80.5%, 89.0%, and 78.5% of total revenue, respectively, reflecting the overly single sales channel structure of Flashback Technology.
During the same period, the revenue contributions from third-party e-commerce platform sales channels were 69.142 million yuan, 62.716 million yuan, 117 million yuan, 65.467 million yuan, and 48.616 million yuan, accounting for 9.2%, 6.8%, 10.1%, 5.0%, and 6.0% of the total revenue, respectively.
In its prospectus, Flashback Technology stated that it would further explore the market potential of live streaming platforms and other third-party e-commerce platforms. However, the results show that this sales channel has consistently failed to help Flashback Technology diversify its risks; instead, its contribution to overall revenue appears to be shrinking.
Selling through third-party e-commerce platforms not only enables access to more incremental users and breaks through geographical and sales channel limitations, but also significantly increases downstream customer repurchase rates through high-frequency traffic entry points and social viral attributes. Therefore, for Flashback Technology, expanding sales channels on third-party e-commerce platforms is not an option, but a necessity.
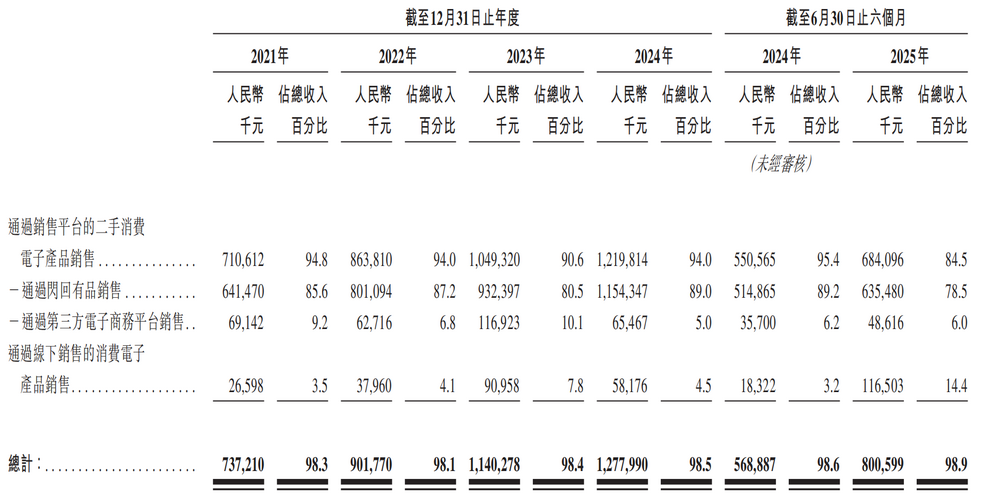
Source of image: Flashback Technology Prospectus
Lastly, the company is under immense pressure from its performance commitment agreement. Flashback Technology is burdened with a huge liability arising from such agreements, which has become a major obstacle on its path to going public. According to the prospectus, Flashback Technology signed special right clauses with redemption options during its Series A, A-1, C, and D financing rounds. If the company fails to complete a qualified IPO by December 31, 2025, the repurchase clause will be triggered, and Flashback Technology will be required to pay nearly 800 million yuan in redemption liabilities.
From 2021 to 2024 and the first half of 2025, Flashback Technology's redemption liabilities amounted to 307 million yuan, 376 million yuan, 685 million yuan, 759 million yuan, and 791 million yuan, respectively. During the same period, its cash and cash equivalents were 55.1 million yuan, 42.8 million yuan, 79.1 million yuan, 93.2 million yuan, and 119.8 million yuan. Clearly, the funds available to Flashback Technology are insufficient to cover its redemption liabilities, and if the buyback clauses are triggered, it will face a severe financial predicament.
3. Frequently Raises Consumer Concerns
Flashback Technology has frequently faced consumer doubts and complaints. On the consumer service platform Black Cat Complaints, searching with the keyword "Flashback Recycling" yields as many as 1,262 related complaints. The main reasons for complaints include malicious price reduction after recycling inspection, phone swapping, selling second-hand phones of inferior quality as genuine, and false advertising.
For example, some consumers have complained that they always used their phones with a case and there were no flaws whatsoever. Before sending the phone by courier, they recorded a video showing that the phone was in perfect condition with no visible defects. However, when the phone arrived at Flash Recycling, it was found to have screen scratches during inspection, which was then used as a reason to maliciously lower the price.
On social media platforms such as Xiaohongshu and Douyin, similar cases are not uncommon, and there are numerous complaints from consumers about Flash Recycling.
Flashback Technology frequently triggers consumer doubts and complaints, which essentially stem from the concentrated outbreak of its business model flaws, cost pressures, and quality control loopholes. Over 90% of Flashback Technology's second-hand phones are procured through the "trade-in" method. However, its upstream procurement partners are highly concentrated. To cope with the rising total procurement costs, the company has to maintain its profits by lowering the recycling prices and reducing quality inspection costs. This, however, may lead to consumer doubts and complaints becoming a "Sword of Damocles" on its road to going public.
【Copyright and Disclaimer】The above information is collected and organized by PlastMatch. The copyright belongs to the original author. This article is reprinted for the purpose of providing more information, and it does not imply that PlastMatch endorses the views expressed in the article or guarantees its accuracy. If there are any errors in the source attribution or if your legitimate rights have been infringed, please contact us, and we will promptly correct or remove the content. If other media, websites, or individuals use the aforementioned content, they must clearly indicate the original source and origin of the work and assume legal responsibility on their own.
Most Popular
-

AI Computing Power Demand Ignites Electronic Fabrics! China Jushi Hits Limit Up! Domestic Substitution Welcomes Golden Window
-

Focus on going global! kingfa sci. leads, huitong, preter, and kumho nire follow, china’s modified plastics frenziedly expanding worldwide
-

Back-to-back major joker moves! covestro’s 1.32 million ton mdi dual-line expansion and hdi acquisition reshape global polyurethane landscape
-

Evonik Parts Ways With The Polyester Business! A Strategic Retreat By A Germany Chemical Giant And The Global Industry Shift
-

PA66 Cost and Profit: Broad-Based Weakness in the Feedstock Market Continues to Erode Cost Support for PA66 (202606)


