


Statistics of domestic pe plants in the coming year
[China's polyethylene production capacity is expected to exceed 45 million tons by 2026, intensifying competition in general-purpose materials. The new capacity will primarily consist of full-density units, with oil-based production dominating and an increased proportion of light hydrocarbon-based production. The main production areas are Northwest and East China. Companies are focusing on flexible production shifts to respond to the market, and industry competition is moving towards high-end differentiation.
Future new capacity continues to be released, and the market may face oversupply.
As the world's largest consumer of polyethylene, China will continue to be a key region for new capacity additions in the future. The implementation of numerous private refining and chemical integration projects and comprehensive light hydrocarbon utilization projects will bring a substantial amount of new polyethylene capacity. It is estimated that between October 2025 and 2026, the planned polyethylene capacity under construction in China will be 9.55 million tons. As of now, domestic polyethylene capacity stands at 37.428 million tons, and by that time, China's total polyethylene capacity is expected to surpass the 45 million-ton mark. The polyethylene market will gradually shift from its previous "tight balance" state to a "loose balance" or even a phase of "supply surplus." Competition among producers will become increasingly intense, especially in the general-purpose material market, potentially leading to more frequent competition and squeezing industry profit margins. Additionally, if the aforementioned facilities commence production as scheduled, the reliance on imported sources will gradually decrease, leading to changes in traditional trade flows. Exporters from the Middle East and North America will need to find new markets for their products, with emerging markets such as Southeast Asia and South Asia becoming increasingly important. While the supply pressure for general-purpose materials increases, high-end polyethylene products (such as metallocene polyethylene and ultra-high molecular weight polyethylene) will remain relatively tight due to higher technical barriers, with more favorable profit margins. The focus of future competition will shift from mere "quantity" to "quality," and enterprises with core technologies and the ability to continuously launch high-performance differentiated products will occupy a more advantageous position in the market.
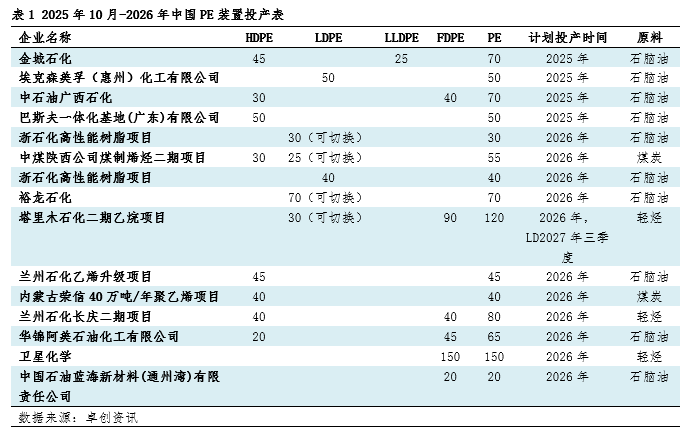
The full-density unit breaks the traditional design of units typically tailored for producing PE within a specific density range, allowing for switching between HDPE and LLDPE products. Currently, mainstream technology is the gas-phase process, mainly including Univation's Unipol PE process and Ineos's Innovene G process. Its core advantage lies in the unit design, which allows for relatively quick switching between different density products to meet market demands, flexibly adjusting production plans to maximize unit utilization and economic benefits. As seen in the table above, the future focus for enterprises is still inclined towards FDPE units, with a total planned production capacity of 3.85 million tons. Additionally, LDPE units have also planned the production of EVA products with a capacity of 1.55 million tons, indicating that companies are switching between multiple products due to market price differentiation and uncertainty. From a production path perspective, naptha as a raw material route accounts for a capacity of 5.10 million tons, still dominated by oil-based production, aligning with recent trends. Coal-based capacity is 950 thousand tons, and light hydrocarbon-based capacity is 3.50 million tons, with an increased proportion of light hydrocarbon-based production. Regarding production regions, the focus has shifted compared to the past five years, with the northwest region accounting for a capacity of 3 million tons, followed by the east region with 2.40 million tons, the north region with 1.80 million tons, and the south region with 1.70 million tons. Due to multiple market uncertainties and factors like trial operation faults, the listed unit production status may experience delays. Zhuochuang Information will continuously monitor the progress of new unit production.
【Copyright and Disclaimer】The above information is collected and organized by PlastMatch. The copyright belongs to the original author. This article is reprinted for the purpose of providing more information, and it does not imply that PlastMatch endorses the views expressed in the article or guarantees its accuracy. If there are any errors in the source attribution or if your legitimate rights have been infringed, please contact us, and we will promptly correct or remove the content. If other media, websites, or individuals use the aforementioned content, they must clearly indicate the original source and origin of the work and assume legal responsibility on their own.
Most Popular
-

AI Computing Power Demand Ignites Electronic Fabrics! China Jushi Hits Limit Up! Domestic Substitution Welcomes Golden Window
-

Focus on going global! kingfa sci. leads, huitong, preter, and kumho nire follow, china’s modified plastics frenziedly expanding worldwide
-

Back-to-back major joker moves! covestro’s 1.32 million ton mdi dual-line expansion and hdi acquisition reshape global polyurethane landscape
-

Evonik Parts Ways With The Polyester Business! A Strategic Retreat By A Germany Chemical Giant And The Global Industry Shift
-

PA66 Cost and Profit: Broad-Based Weakness in the Feedstock Market Continues to Erode Cost Support for PA66 (202606)


