


Songwon Releases Q2 Financial Results, Achieves Sales of KRW 265.4 Billion
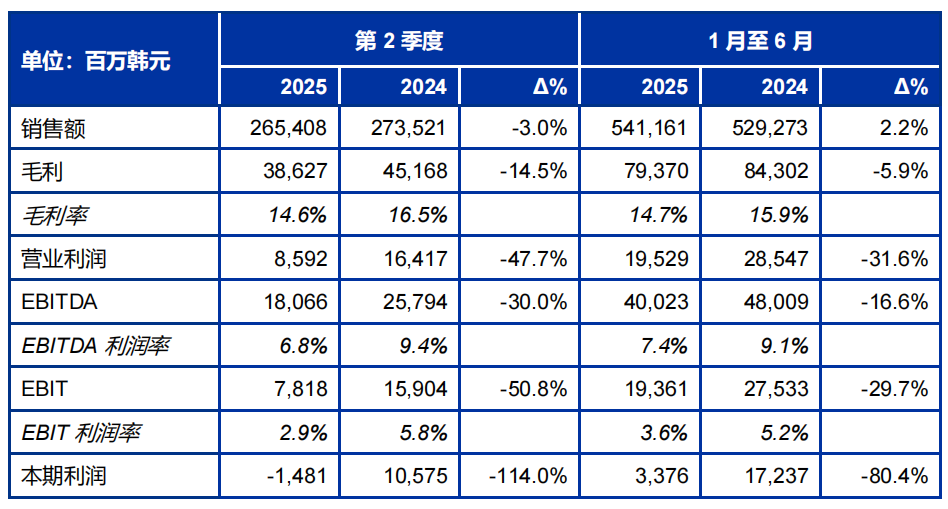
On August 13, SONGWON Industrial Group released its financial performance report for the second quarter and the first half of fiscal year 2025. In this quarter, the group achieved consolidated sales of 265.408 billion KRW, a 3.0% decrease compared to the same period last year (Q2 2024: 273.521 billion KRW). Year-to-date (YTD), the group's consolidated sales amounted to 541.161 billion KRW, a 2.2% increase from the same period in 2024 (as of the end of June: 529.273 billion KRW). Due to ongoing margin pressures and increased labor costs resulting from a court ruling in Korea earlier this year, SONGWON recorded a loss of 1.481 billion KRW in Q2 2025, with a first half profit of 3.376 billion KRW, both figures lower than the 10.575 billion KRW and 17.237 billion KRW recorded in the same periods last year, respectively. The group's gross margin for the second quarter of 2025 was 14.6%, and for the first half of 2025 was 14.7%.
In the second quarter of 2025, SONGWON's various divisions continued to face challenges carried over from the first quarter of this year. A combination of sluggish global demand, geopolitical uncertainties, and ongoing margin pressures in key regions has created a difficult market environment. Although raw material costs have stabilized somewhat, the situation remains challenging: customers are cautious, and overcapacity persists in several product areas. Revenue in the Chemicals division decreased by 7.6% year-on-year, with second-quarter sales in 2025 amounting to KRW 191.019 billion, down from KRW 206.816 billion in the second quarter of 2024. However, in the first half of 2025, this division achieved sales of KRW 399.152 billion, remaining stable compared to KRW 399.601 billion in the first half of 2024. In contrast, the Performance Chemicals division performed strongly in the second quarter of 2025, with sales up 11.5% to KRW 74.389 billion; year-to-date revenue grew by 9.5% to KRW 142.009 billion.
Despite weak global demand, intense competition, and ongoing price pressures, the Chemical Raw Materials Division achieved expected results in the challenging second quarter of 2025. Although the polymer stabilizer business saw a year-on-year decline in sales due to weak demand and geopolitical uncertainties, particularly regarding uncertainty surrounding U.S. tariff policies, turnover remained close to 2024 levels, and overall performance met expectations. The fuel and lubricant additives business performed strongly at the beginning of the year, but in the second quarter of 2025, sales declined compared to the first quarter. This was due to a decrease in raw material costs (affecting formula-based pricing) and intensified competition in the spot market, leading to reduced revenue. The coatings business continued its positive momentum from the beginning of the year, maintaining stable sales and revenue in the second quarter of 2025. It performed better than the industry average, particularly in the European and Asian markets, and expanded its market share.
Despite ongoing challenges in the construction and automotive industries, the high-performance chemicals business continued its strong performance from the previous quarter in Q2 2025. The tin intermediates business experienced weak demand in Q2 2025 due to intensified global competition, price declines, and logistical issues in Europe. However, the increase in tin ingot prices partially supported revenue. The PVC business continued to face pressure from aggressive pricing and unpredictable customer purchasing behaviors. Despite the tense economic situation, the thermoplastic polyurethane and solution polyurethane (TPU/SPU) businesses achieved strong profitability supported by stable raw material costs, and TPU export sales grew as expected.
Throughout the second quarter of 2025, macroeconomic factors such as geopolitical restrictions, regulatory changes, and the slow recovery of China continued to impact market demand. Additionally, increased uncertainty in U.S. trade policy, currency fluctuations, and increased sales activities in China intensified competition in key markets, particularly in Asia and Europe. Looking ahead, overall economic growth is expected to slow, and demand may remain below previous expectations as oversupply continues to pressure margins. Over the next six months, SONGWON will continue to focus on global development dynamics and is confident in its ability to address emerging challenges and maintain reliable product supply for its customers.
【Copyright and Disclaimer】The above information is collected and organized by PlastMatch. The copyright belongs to the original author. This article is reprinted for the purpose of providing more information, and it does not imply that PlastMatch endorses the views expressed in the article or guarantees its accuracy. If there are any errors in the source attribution or if your legitimate rights have been infringed, please contact us, and we will promptly correct or remove the content. If other media, websites, or individuals use the aforementioned content, they must clearly indicate the original source and origin of the work and assume legal responsibility on their own.
Most Popular
-

AI Computing Power Demand Ignites Electronic Fabrics! China Jushi Hits Limit Up! Domestic Substitution Welcomes Golden Window
-

Focus on going global! kingfa sci. leads, huitong, preter, and kumho nire follow, china’s modified plastics frenziedly expanding worldwide
-

Back-to-back major joker moves! covestro’s 1.32 million ton mdi dual-line expansion and hdi acquisition reshape global polyurethane landscape
-

Evonik Parts Ways With The Polyester Business! A Strategic Retreat By A Germany Chemical Giant And The Global Industry Shift
-

PA66 Cost and Profit: Broad-Based Weakness in the Feedstock Market Continues to Erode Cost Support for PA66 (202606)


