


Sales Continue to Rebound: Who Says Fuel Cars Are Done?
In an overlooked corner, the stubborn fuel vehicles are quietly making a comeback.
The unstoppable rise of new energy vehicles and the gradual decline of fuel vehicles have almost become a consensus both within and outside the industry. There has been ongoing heated discussion about whether the penetration rate of new energy vehicles has reached a turning point. Fuel vehicles seem to be pushed to the margins.
However, in an unpromising corner, stubborn fuel vehicles are quietly mounting a counterattack. According to data from the China Automobile Data Research Institute, in June, the retail sales of fuel vehicles reached 973,000 units, a year-on-year increase of 6.2%, ending a previous trend of decline over several months. In July, the momentum for fuel vehicles strengthened further, with domestic sales climbing to 981,000 units, and the year-on-year growth rate expanding to 8.4%. By August, this trend was further solidified, as domestic sales of fuel vehicles broke the million mark, reaching 1,074,000 units, a month-on-month increase of 9.5% and a year-on-year increase of 12.9%.
As fuel vehicles stabilize, new energy vehicles have also made breakthroughs in penetration rates, but pressures have started to emerge behind the growth. Especially with the implementation of the purchase tax next year and the recent tightening of related policies, not only have these factors directly impacted some consumers' car purchasing decisions, but they have also to some extent exhausted next year's market sales.
From the perspective of the persistence of market trends, the recent rebound in sales of fuel vehicles is certainly not a fleeting coincidence. With the elimination of price bubbles, the addressing of smart deficiencies, and the tightening of electric vehicle subsidy policies, fuel vehicles have regained a bit of breathing room.
Sales of fuel vehicles have rebounded for several consecutive months.
According to data from the China Passenger Car Association, retail sales of fuel-powered passenger cars continued to climb in September.
In August, the retail sales of narrow passenger cars in China reached 2.018 million units, among which the retail sales of new energy narrow passenger cars were 1.115 million units. Thus, it can be inferred that the retail sales of fuel-powered narrow passenger cars were 903,000 units. According to the latest data from the Passenger Car Association, retail sales in the national passenger car market in September reached 2.241 million units, with retail sales of new energy passenger cars at 1.296 million units. Therefore, it can be inferred that the retail sales of fuel-powered narrow passenger cars were 945,000 units, which is higher than the previous forecast of 900,000 units.
The recovery of the fuel vehicle market is closely related to the completion of intelligent shortfalls and the concessions in terminal prices.
The intelligent experience has become one of the core decision-making factors for consumers when purchasing a car. As early as the J.D. Power 2023 NVIS study, it was shown that the influence of price on potential consumers continues to weaken, while the weight of the intelligent experience in automobiles has risen to 14%, becoming the third largest decision-making factor, only behind car quality (18%) and car performance (16%), and equal to car design (14%), far exceeding the influence of brand (13%) and price (13%).
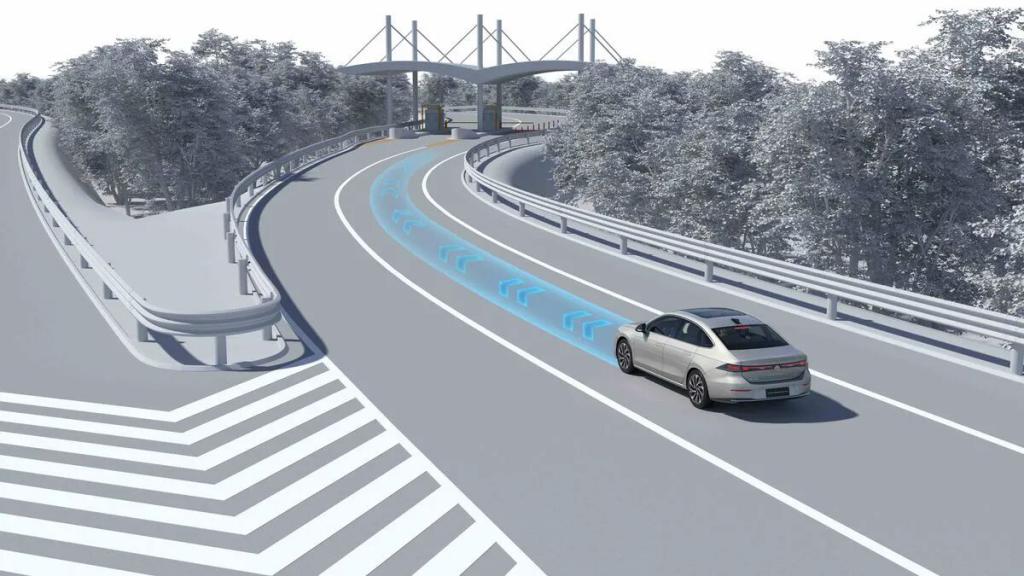
However, constrained by traditional configuration logic, conventional fuel vehicles have always struggled in the field of intelligence: assisted driving could only achieve basic highway cruise control and was helpless in the face of complex road conditions. The intelligent cockpit was even more of a "shortcoming," with the car system lagging, voice interactions being irrelevant, and even basic navigation updates not being timely, leaving users frequently disappointed.
However, with hardware adaptation and software upgrades, "intelligent hybrid" is gradually becoming a reality.
Taking the newly launched all-new generation Sagitar L as an example, in terms of hardware, the new car is equipped with 7 cameras, 5 millimeter-wave radars, and 12 ultrasonic radars. Inside, it features a 15-inch 2K floating central control screen, a 10.25-inch fully digital instrument cluster, and a W-HUD head-up display system. On the software side, the new car is equipped with the IQ.Pilot enhanced driving assistance system, which covers 95% of urban road conditions and 100% of highway scenarios, capable of achieving highway pilot assistance, precise ramp navigation, smooth obstacle avoidance, and start-stop at traffic lights, among other functions.
While addressing the shortcomings of intelligence, fuel vehicles have also made significant moves in terms of size and price.
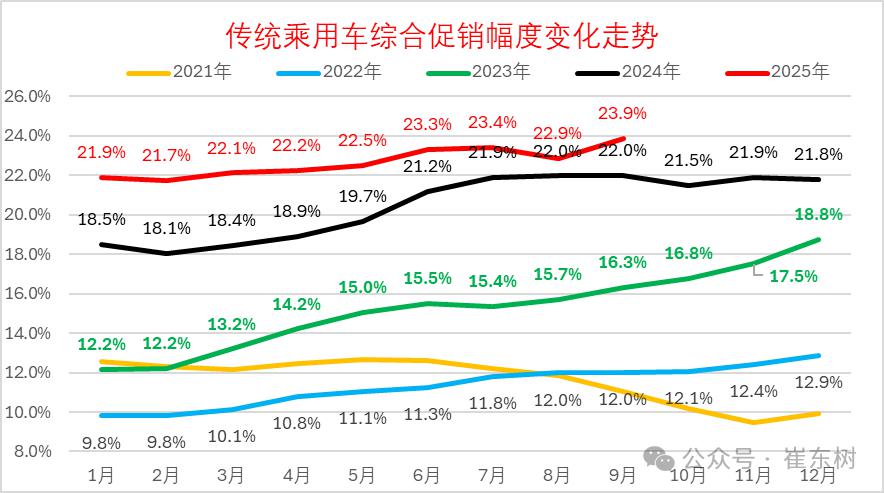
Data shows that the promotion rate for traditional fuel vehicles in September stabilized at 23.9%, an increase of 1 percentage point from the previous month and an increase of 1.9 percentage points year-on-year. Previously, the fixed-price policy introduced by joint venture brands proved to be effective. Models such as the Regal, Sylphy, Teana, and Corolla saw significant sales boosts under the attractive fixed-price policy.
In addition to fixed pricing, competitive positioning is also a powerful means for fuel vehicles to boost sales. Taking the Sagitar L as an example, after its recent launch, the Sagitar L not only has a length of 4812mm, giving it an advantage among A+ class vehicles, but its price has also reached a historical low. Launched in China in 2006, the Sagitar was priced between 140,000 and 210,000 yuan, while after the upgrade, the starting price of the Sagitar L has dropped to 110,000 yuan, and the top model is priced at less than 130,000 yuan.
New energy dominates, but fuel vehicles have a "backup."
Despite the stable recovery trend in fuel, the increase in new energy vehicles is larger, and their penetration rate continues to rise steadily.
In September, the retail sales of new energy passenger vehicles reached 1.296 million units, a year-on-year increase of 15.5%, significantly higher than that of fuel vehicles. This also helped the retail penetration rate of new energy passenger vehicles in September climb to 57.8%, an increase of 5 percentage points compared to the same period last year, and a month-on-month growth of 2.6% compared to August.
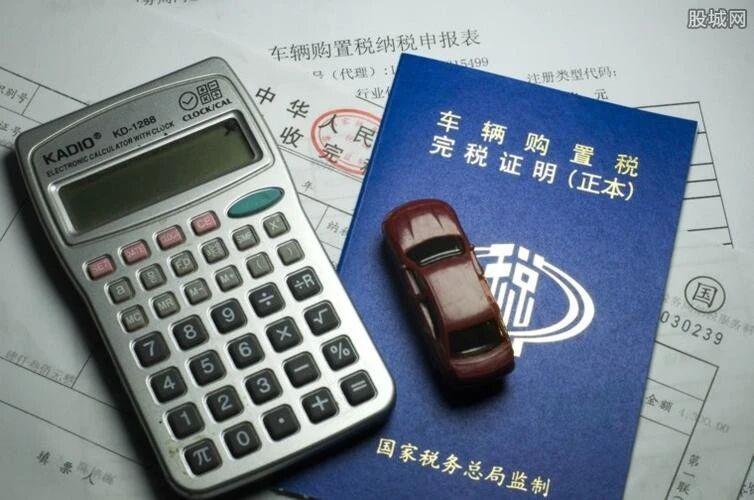
From a short-term perspective, the policy of halving the vehicle purchase tax starting in 2026 will greatly stimulate consumers to complete their car purchases within the year.
When visiting stores, a Xiaomi salesperson mentioned that the purchase tax greatly impacts customers' decision to place orders: "Many people give up after hearing that the car will take a year to deliver, and then 90% of them give up after hearing about the purchase tax. Only those who really like it would proceed."
Sales further explain that, just as consumers prefer to have shipping costs included in the price of clothing rather than paying for postage separately, you can include this cost in the base price of a car, but you cannot add it to the purchase tax.
In addition, with the implementation of the subsidy policy for replacement and the sales push from various car manufacturers at the end of the year, there is still significant potential for the penetration rate of new energy vehicles to explode. After the implementation of the vehicle purchase tax in 2026, fuel vehicles will also have the opportunity to regain more initiative.
Against the backdrop of the rapid advancement of new energy vehicles, every sales rebound of traditional fuel vehicles is easily labeled as a short-term rebound and is subject to controversy. However, from the continuous growth from June to September, the substantial improvement in intelligent features, to the precise competition in pricing and size, fuel vehicles are proving through a series of actions that their vitality does not rely on policy buffers or market coincidences, but rather on a re-adaptation to user needs.
Of course, we still need to remain clear-headed and recognize that the 57.8% penetration rate and 15.5% year-on-year growth of new energy vehicles still highlight the overall direction of industry transformation. The short-term stimulus from purchase tax policies and ongoing cost reductions from technological iterations will continue to inject momentum into the new energy market. The possibility of fuel vehicles regaining their dominant market position is extremely unlikely.
This does not mean that fuel vehicles will withdraw from the stage. In the vast lower-tier markets, there are still many users whose sensitivity to charging facilities and vehicle costs is lower than their demand for immediate refueling and maintenance convenience. In certain specific scenarios, the endurance stability and low-temperature adaptability of fuel vehicles still have irreplaceable advantages.
For fuel vehicles, this warm-up feels more like a strategic adjustment. By upgrading intelligence to shed outdated labels, consolidating the customer base through competitive cost-performance, and optimizing technology to reduce energy consumption and emissions, they can find their own long-term survival space amidst the growth of new energy.
【Copyright and Disclaimer】The above information is collected and organized by PlastMatch. The copyright belongs to the original author. This article is reprinted for the purpose of providing more information, and it does not imply that PlastMatch endorses the views expressed in the article or guarantees its accuracy. If there are any errors in the source attribution or if your legitimate rights have been infringed, please contact us, and we will promptly correct or remove the content. If other media, websites, or individuals use the aforementioned content, they must clearly indicate the original source and origin of the work and assume legal responsibility on their own.
Most Popular
-

AI Computing Power Demand Ignites Electronic Fabrics! China Jushi Hits Limit Up! Domestic Substitution Welcomes Golden Window
-

Focus on going global! kingfa sci. leads, huitong, preter, and kumho nire follow, china’s modified plastics frenziedly expanding worldwide
-

Back-to-back major joker moves! covestro’s 1.32 million ton mdi dual-line expansion and hdi acquisition reshape global polyurethane landscape
-

Evonik Parts Ways With The Polyester Business! A Strategic Retreat By A Germany Chemical Giant And The Global Industry Shift
-

PA66 Cost and Profit: Broad-Based Weakness in the Feedstock Market Continues to Erode Cost Support for PA66 (202606)


