


Restructuring and Upgrading! Chemical Giant Huntsman Plans Global Layoff of 10%
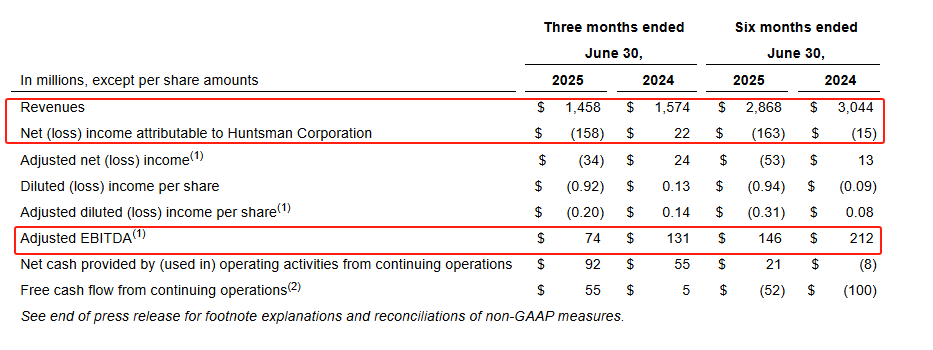
On July 31, Huntsman released its second-quarter and half-year financial results. Revenue for the first half of 2025 was $2.868 billion, down 6% year-on-year; net loss attributable to Huntsman was $163 million, compared to a net loss of $15 million in the same period last year; adjusted EBITDA was $146 million, down 31.1% year-on-year.
In the second quarter of 2025, revenue was $1.458 billion, down 7.4% year-on-year; net loss attributable to Huntsman was $158 million, compared to net income of $22 million in the same period last year; adjusted EBITDA was $74 million, a year-on-year decrease of 43.5%.
Chairman, President and Chief Executive Officer Peter R. Huntsman stated:
Due to the reduction in global construction and industrial activities putting pressure on our output, our second quarter performance was basically in line with expectations. The seasonal increase in construction demand that we usually see in the second quarter was weaker in 2025, and we believe this trend will not change significantly in the third quarter.
In view of the current returns, we have taken decisive measures to reduce costs and restructure, including the closure of the maleic anhydride plant in Moers, Germany, as well as other downstream plants in Europe and North America. The restructuring plan initiated at the end of 2024 will be further expanded in 2025, ultimately resulting in a nearly 10% reduction in our global workforce, with the largest layoffs occurring in the European region.
Through our cash management activities, we achieved positive cash flow in the second quarter. As we have stated in the past, while leading the company through the current environment, maintaining the balance sheet remains our top priority in addition to focusing on cash generation.
Huntsman reportedly has over 60 manufacturing, research, and operational facilities in about 25 countries/regions and employs approximately 6,300 people. This round of layoffs is expected to affect around 600 people. Huntsman's revenue from continuing operations in 2024 is approximately $6 billion.
Revenue from all business segments is unsatisfactory.
From the performance of Huntsman's various businesses, both revenue and adjusted EBITDA for the first half and the second quarter of 2025 declined year-on-year.
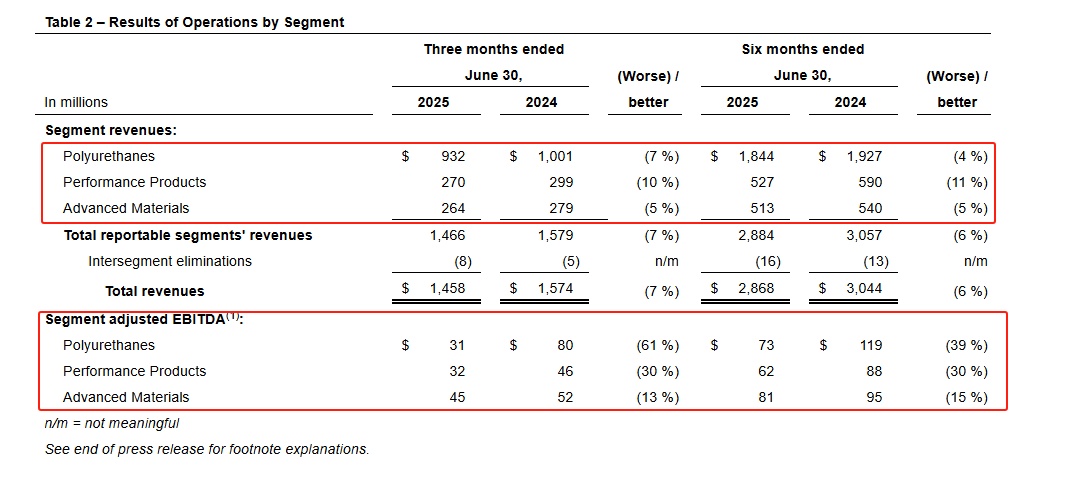
Polyurethane Business: Revenue for the first half of 2025 decreased by 4% year-on-year, and revenue for the second quarter decreased by 7% year-on-year, mainly due to declines in both average selling price and sales volume. The decrease in average MDI selling price was primarily caused by unfavorable supply and demand dynamics. The decline in sales volume was mainly due to reduced demand in construction-related markets, as well as the planned maintenance of the manufacturing plant in Rotterdam, the Netherlands, scheduled for the second quarter of 2025.The second quarterAdjusted EBITDA decreased year-on-year by61%,The impact was primarily due to a decrease in average selling prices, a decline in sales volume, a reduction in inventory, and a decrease in equity earnings from minority-owned joint ventures in China, but these effects were partially offset by a reduction in raw material costs and fixed costs.
Functional Product Business:Revenue in the first half of 2025 decreased by 11% year-on-year.In the second quarter, revenue decreased by 10% year-on-year, mainly due to a decline in sales volume. The average selling price remained relatively stable, as the decrease in price was largely offset by a favorable sales mix. The decline in sales volume was primarily due to reduced operating rates at the factory located in Moers, Germany, and a weak market environment, but it was partially offset by an increase in market share.The second quarterThe adjusted EBITDA decreased by 30% year-on-year, primarily due to a decline in sales revenue and the adverse impact of reduced inventory, but was partially offset by a decrease in variable direct costs and other fixed costs.
Advanced Materials Business: Revenue in both the first half and the second quarter of 2025 decreased by 5% year-on-year, in the second quarter.Adjusted EBITDA decreased by 13% year-over-year.The main reasons are the decrease in average selling price and the decline in sales. The decline in sales is mainly due to reduced demand in the coatings and aerospace markets.
【Copyright and Disclaimer】The above information is collected and organized by PlastMatch. The copyright belongs to the original author. This article is reprinted for the purpose of providing more information, and it does not imply that PlastMatch endorses the views expressed in the article or guarantees its accuracy. If there are any errors in the source attribution or if your legitimate rights have been infringed, please contact us, and we will promptly correct or remove the content. If other media, websites, or individuals use the aforementioned content, they must clearly indicate the original source and origin of the work and assume legal responsibility on their own.
Most Popular
-

AI Computing Power Demand Ignites Electronic Fabrics! China Jushi Hits Limit Up! Domestic Substitution Welcomes Golden Window
-

Focus on going global! kingfa sci. leads, huitong, preter, and kumho nire follow, china’s modified plastics frenziedly expanding worldwide
-

Back-to-back major joker moves! covestro’s 1.32 million ton mdi dual-line expansion and hdi acquisition reshape global polyurethane landscape
-

Evonik Parts Ways With The Polyester Business! A Strategic Retreat By A Germany Chemical Giant And The Global Industry Shift
-

PA66 Cost and Profit: Broad-Based Weakness in the Feedstock Market Continues to Erode Cost Support for PA66 (202606)


