


Quick Look! Latest Q2 2025 Results of 15 Foreign Chemical Giants
Recently, 15 international chemical giants including Arkema, BASF, DuPont, Honeywell, Huntsman, Covestro, Clariant, LyondellBasell, Dow, SABIC, Solvay, Wacker, Eastman, Evonik, and Syensqo have successively released their financial reports for the second quarter of 2025. These reports not only present the performance of each company in the past quarter, but also reflect the overall development trends and market dynamics of the chemical new materials industry.
The following are the specific performance details of these companies for the second quarter of 2025, in no particular order!
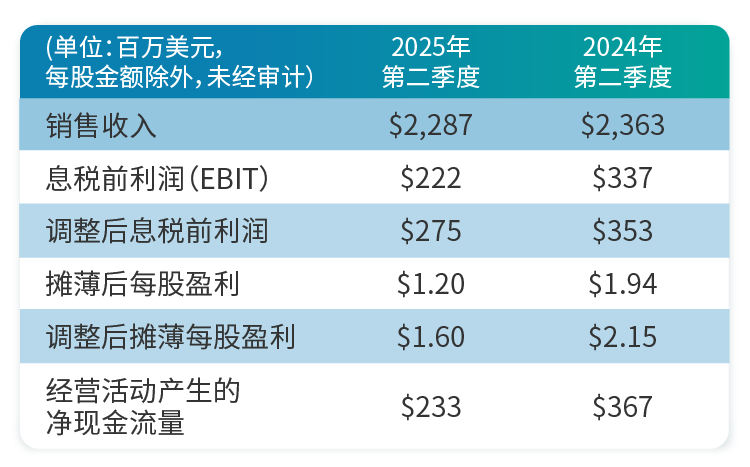
Arkema
In the second quarter of 2025, Arkema achieved sales of €2.4 billion, representing a year-on-year decrease of 2.3%. Sales volume declined by 1.3%, mainly due to overall demand in the European and US markets falling short of expectations, while the Asian market performed positively, partially offsetting the decline. EBIT decreased to €364 million (compared to €451 million in Q2 2024), with an EBIT margin of 15.2%. Adjusted net income was €118 million, and cash flow reached €111 million.
BASF
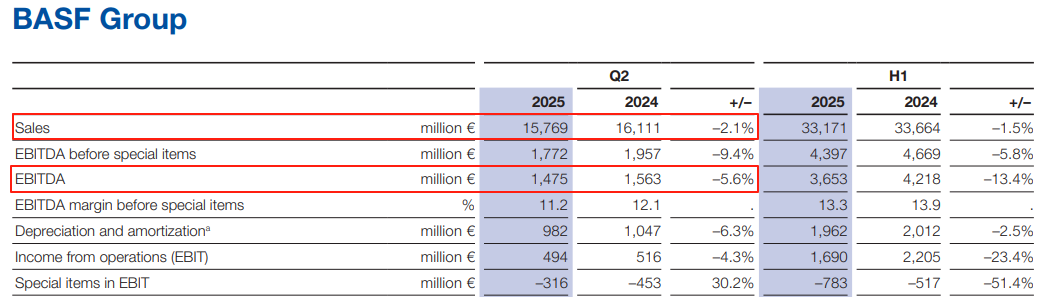
BASF's sales for the quarter amounted to 15.8 billion euros, down by 342 million euros compared to the same period last year. This development was mainly driven by negative currency effects and price declines. EBITDA reached 1.5 billion euros, compared to 1.6 billion euros in the same period last year. EBIT amounted to 494 million euros, a decrease of 22 million euros compared to the same period last year. Net income was 79 million euros.
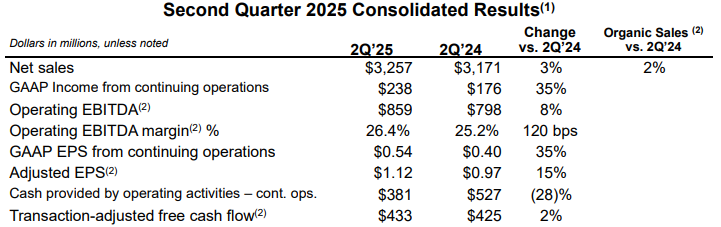
DuPont’s financial report for the second quarter of 2025 shows that its net sales reached $3.257 billion, an increase of approximately 3.1% compared to the same period last year. Under US GAAP, income from continuing operations was $238 million, representing a year-on-year increase of 35%. Operating EBITDA was $859 million, up 8% year-on-year.
From the perspective of specific business development, there have been the following important advancements:
(1) The electronics business performed impressively, with both net sales and organic sales achieving 6% growth, and the operating EBITDA margin reaching 31.9%.
(2) Demand in the healthcare sector (covering biopharmaceuticals, medical packaging, etc.) and the water treatment end market (driven by reverse osmosis technology) has gradually recovered, driving low single-digit organic growth in related businesses. Both net sales and organic sales increased by 1% year-on-year, and the operating EBITDA margin was 24.4%.
Honeywell
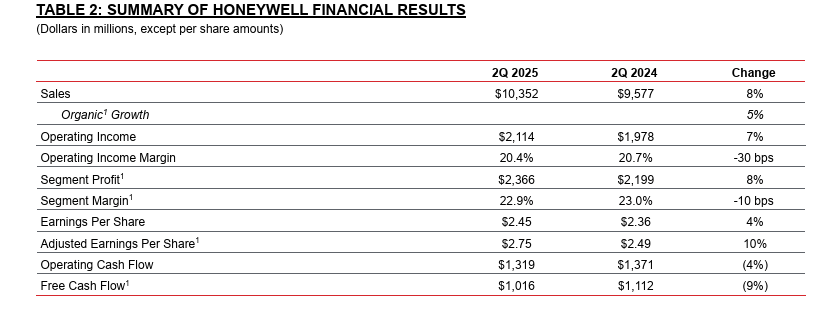
In the second quarter, sales reached $10.4 billion (approximately RMB 74.5 billion), an increase of 8% year-over-year, with organic sales growth of 5%. Both the Defense and Space segment and the UOP segment achieved double-digit organic sales growth. Driven by growth in the Building Automation segment, operating income was $2.11 billion, up 7% year-over-year, with division profit increasing by 8% to $2.4 billion.
Operating profit margin contracted by 30 basis points to 20.4%, and segment profit margin contracted by 10 basis points to 22.9%, both in line with previous expectations. Second-quarter earnings per share were $2.45, up 4% year-over-year, while adjusted earnings per share were $2.75, up 10% year-over-year. Operating cash flow was $1.3 billion, down 4% year-over-year, and free cash flow was $1.0 billion, down 9% year-over-year.
Huntsman
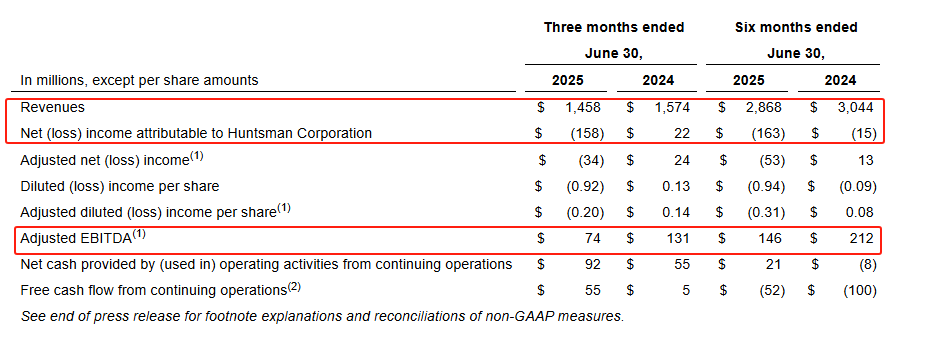
In the first half of 2025, revenue was $2.868 billion, down 6% year-on-year; net loss attributable to Huntsman was $163 million, compared to a net loss of $15 million in the same period last year; adjusted EBITDA was $146 million, down 31.1% year-on-year.
In the second quarter of 2025, revenue was $1.458 billion, a year-on-year decline of 7.4%; the net loss attributable to Huntsman was $158 million, compared to a net income of $22 million in the same period last year; adjusted EBITDA was $74 million, a year-on-year decrease of 43.5%.
Covestro
Covestro’s sales in the second quarter were €3.4 billion, down 8.4% year-on-year, mainly due to a decline in product prices. EBITDA was €270 million, down 15.6% year-on-year, in line with previous forecasts. Consolidated net income was -€59 million (net loss). Free operating cash flow was -€228 million.
Clariant
In the second quarter of 2025, sales remained stable while profitability significantly improved. The sales for the second quarter amounted to 968 million Swiss francs, which is equivalent to the sales in the second quarter of 2024 when measured in local currency, with both prices and volumes remaining stable.
The Group’s EBITDA excluding special items was CHF 169 million, representing a year-on-year increase of 3%. The corresponding margin was 17.5%, an improvement of 200 basis points compared to 15.5% in the same period last year.
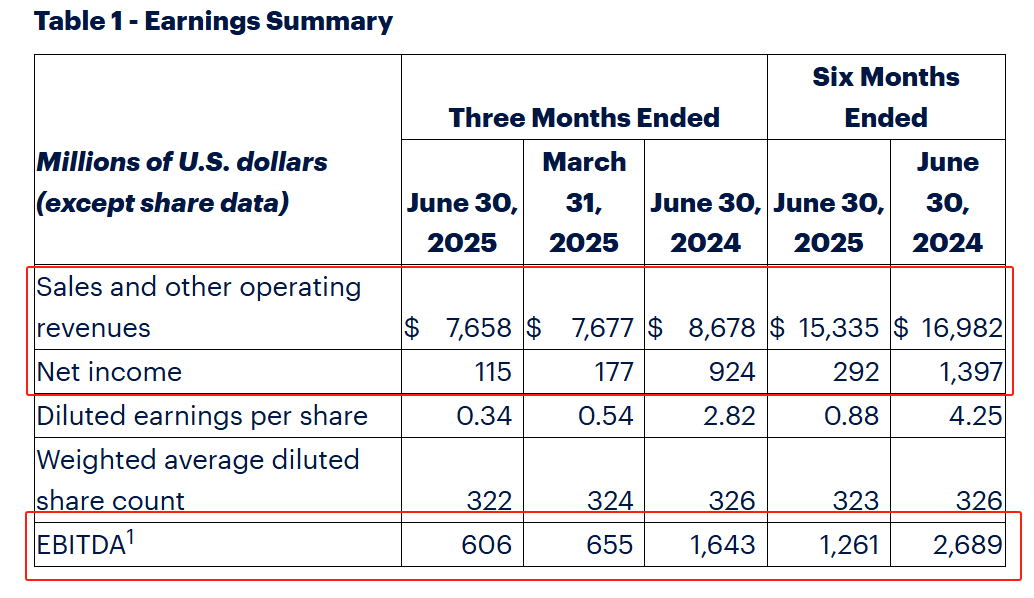
LyondellBasell (LYB)
In the first half of 2025, revenue was $15.335 billion, down 9.7% year-on-year; net income was $292 million, down 79.1% year-on-year; EBITDA was $1.261 billion, down 53.1% year-on-year. In the second quarter, revenue was $7.658 billion, a slight decrease year-on-year; net income was $115 million, down 35% year-on-year; EBITDA was $606 million, down 7.5% year-on-year.
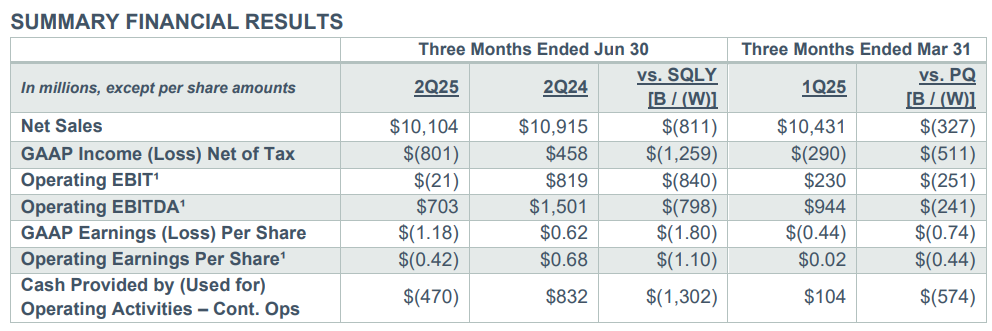
In the second quarter of 2025, Dow Chemical reported net sales of $10.1 billion, a year-over-year decline of 7%, with declines across all operating segments. Volume decreased by 1% year-over-year, with growth in the U.S. and Canadian markets completely offset by declines in Europe, the Middle East, Africa, and India. Sequentially, volume decreased by 2%. Prices fell by 7% year-over-year and 3% sequentially, primarily due to pressure on global chemical product prices.
Operating profit posted a loss of $21 million, a year-on-year decrease of $840 million, mainly due to price declines and reduced equity income. Net loss was $801 million, compared to $458 million in the same period last year. Cash flow from operating activities was -$470 million, down $1.3 billion year-on-year and $574 million quarter-on-quarter, mainly due to margin compression.
SABIC
Saudi Basic Industries Corporation (SABIC) reported an adjusted net income of approximately 500 million riyals for the second quarter, compared to an adjusted net loss of about 100 million riyals in the previous quarter, representing an increase of 555 million riyals.
The company’s total sales in the second quarter amounted to 35.6 billion riyals, representing a 3% increase compared to 34.6 billion riyals in the first quarter. Total sales volume in the second quarter was 11.779 million tons, a 3% increase from 11.477 million tons in the first quarter.
Sissoko
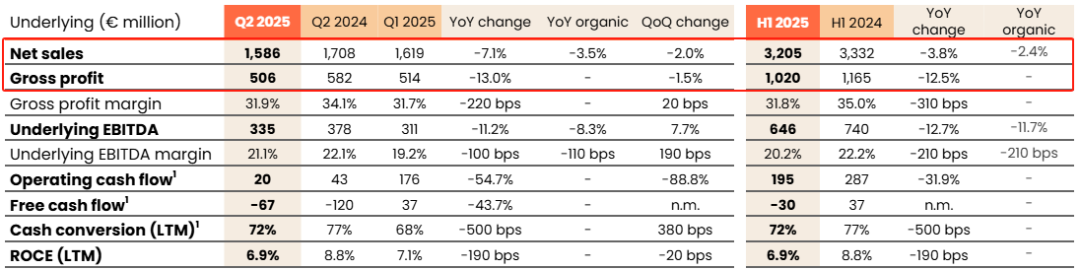
In the first half of 2025, net sales reached 3.205 billion euros, a year-on-year decrease of 3.8%. Gross profit amounted to 1.02 billion euros, down 12.5% year-on-year. For the second quarter of 2025, net sales reached 1.59 billion euros, a year-on-year decrease of 7.1%, impacted by unfavorable year-on-year exchange rate changes (-4%) and a decrease in sales volume (-3%), while prices remained generally stable. There was year-on-year growth in the consumer and industrial specialty chemicals business. Gross profit was 506 million euros, down 13% year-on-year, mainly due to decreased sales volume and unfavorable exchange rate changes. The gross margin was 31.9%, an increase of 20 basis points quarter-on-quarter.
Basic EBITDA amounted to €335 million, representing an organic year-on-year decline of 8%, mainly due to a decrease in the core EBITDA of the specialty polymers business, although it achieved an 8% growth quarter-on-quarter. The basic EBITDA margin contracted organically by 110 basis points year-on-year to 21.1%, but thanks to improvements in both the materials segment and the performance and maintenance segment, the basic EBITDA margin increased by 190 basis points quarter-on-quarter. Basic net profit (Suez share) was €140 million; operating cash flow was €20 million; free cash flow was -€67 million.
The financial report shows that Wacker achieved sales of approximately 1.41 billion euros during the reporting period (Q2 2024: 1.47 billion euros), a year-on-year decrease of 4%. The main reasons for this were the weak US dollar and a decline in sales volume. Sales also decreased by 4% compared to the previous quarter (1.48 billion euros).
Earnings before interest, taxes, depreciation, and amortization (EBITDA) amounted to €114 million (Q2 2024: €155 million), representing a year-on-year decrease of 26%. The main reasons were a decline in sales volume and lower capacity utilization in some areas.
In the second quarter, the Group's EBIT was lower than the same period last year due to the aforementioned impacts, amounting to -11 million euros (Q2 2024: 38 million euros), with an EBIT margin of -0.8% (Q2 2024: 2.6%). The cumulative net profit for the second quarter was -19 million euros, a negative value (Q2 2024: 35 million euros); earnings per share amounted to -0.49 euros (Q2 2024: 0.58 euros).
Eastman
The financial report for the second quarter of 2025 shows
● Maintain a stable price-cost margin for specialty product businesses, consolidate market share, and continuously demonstrate excellent business operation capabilities.
Additives and functional materials business achieved strong performance, primarily due to the optimization of the product portfolio and leveraging stable end markets; despite facing severe challenges in key end markets, the specialty materials business still achieved steady performance.
Evonik’s revenue for the second quarter of 2025 was €3.5 billion, representing an 11% year-on-year decline (Q2 2024: €3.93 billion). More than half of the revenue decrease was attributable to adverse currency effects and the divestment of the superabsorbents business (which was still part of Evonik in Q2 2024). Adjusted EBITDA fell by 12% year-on-year to €509 million. In addition, sales volumes decreased by 4%. Sales of C4 chain products were below average, and longer-than-planned maintenance shutdowns at production facilities for products such as polyamide 12 (PA12) also weighed on revenue. The adjusted EBITDA margin was 14.5%, remaining broadly stable compared to the prior-year period (14.7%). Net profit reached €120 million.
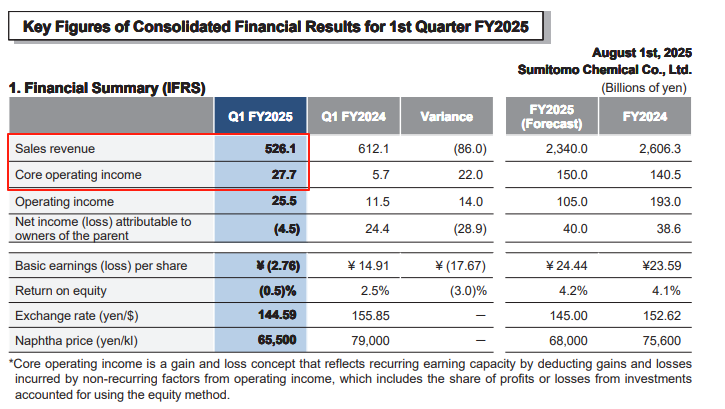
Sumitomo Chemical
Sumitomo Chemical announced its financial results for the first quarter of fiscal year 2025. Quarterly revenue was 526.1 billion yen, a decrease of 86 billion yen or 14.0% compared to the same period of fiscal year 2024. The depreciation of the yen and weak demand in some business areas jointly dragged down the revenue performance. Core operating profit (a measure of sustainable earnings): Core operating profit surged year-on-year, rising to 27.7 billion yen, an increase of 22 billion yen.
【Copyright and Disclaimer】The above information is collected and organized by PlastMatch. The copyright belongs to the original author. This article is reprinted for the purpose of providing more information, and it does not imply that PlastMatch endorses the views expressed in the article or guarantees its accuracy. If there are any errors in the source attribution or if your legitimate rights have been infringed, please contact us, and we will promptly correct or remove the content. If other media, websites, or individuals use the aforementioned content, they must clearly indicate the original source and origin of the work and assume legal responsibility on their own.
Most Popular
-

AI Computing Power Demand Ignites Electronic Fabrics! China Jushi Hits Limit Up! Domestic Substitution Welcomes Golden Window
-

Focus on going global! kingfa sci. leads, huitong, preter, and kumho nire follow, china’s modified plastics frenziedly expanding worldwide
-

Back-to-back major joker moves! covestro’s 1.32 million ton mdi dual-line expansion and hdi acquisition reshape global polyurethane landscape
-

Evonik Parts Ways With The Polyester Business! A Strategic Retreat By A Germany Chemical Giant And The Global Industry Shift
-

PA66 Cost and Profit: Broad-Based Weakness in the Feedstock Market Continues to Erode Cost Support for PA66 (202606)


