


PVC Monthly Report: Futures fall below the "5" mark again, expectations have not been fulfilled as spot prices return to low levels.
01
Domestic PVC Market Analysis
1. Overview of the Domestic PVC Market
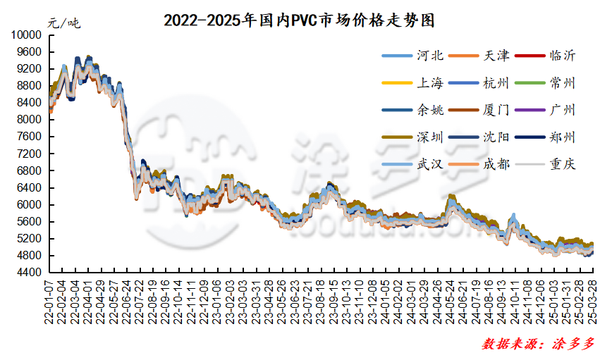
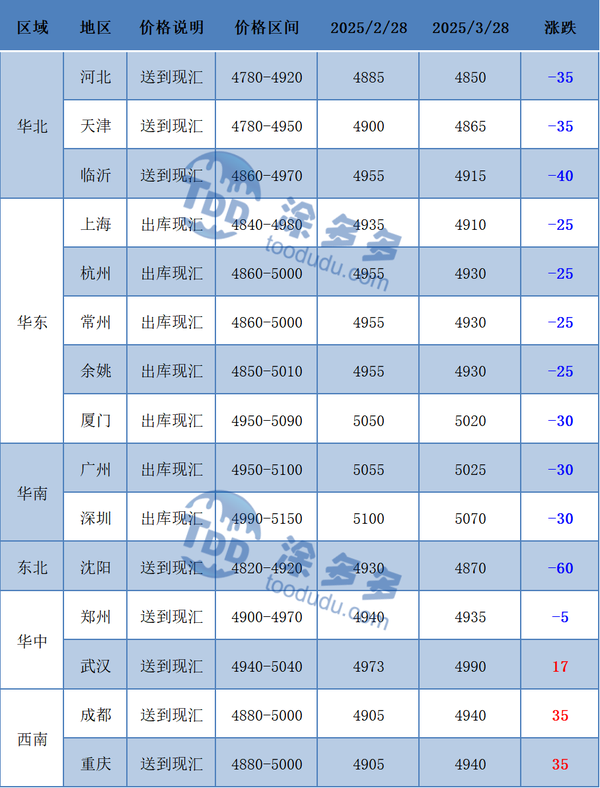
This month's PVC spot market price trend once again showed a downward trend in March, with the futures hitting a low of 4992, refreshing the low point for the year 2025. The overall trend of the spot market first declined and then rose, with factory prices dropping back to low levels.
2. Taiwan Province of China Formosa Plastics Shipping Schedule Quotation
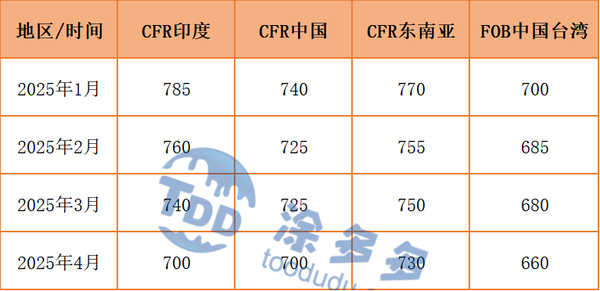
In April, the export shipping price of Taiwan's Formosa Plastics PVC was reduced by $20-40/ton. The FOB price in Taiwan is $680, the CFR price to mainland China is $700, the CFR price to India is $700, and the CFR price to Southeast Asia is $730.
Taiwan Province, China, Formosa Plastics April shipping schedule quotation: (USD/ton)
3. Market Forecast
In terms of futures: The price movement of the PVC2501 contract on Friday showed no significant changes in its fluctuation range, remaining in a sideways state throughout the day, forming a doji candlestick. In terms of trading, both long and short positions did not show any significant movement, and there was a slight reduction in positions on Friday. From a technical perspective, the Bollinger Bands (13, 13, 2) have an upward opening, with the middle and upper bands clearly turning upward, while the lower band remains flat. The KD lines on the daily chart show a narrowing distance, and the MACD line continues to show a golden cross trend. Currently, the direction of the trend line is also unclear, and there are not many fundamental factors influencing the short term. Therefore, the price movement is likely to remain difficult to escape from the sideways trend, with attention on the fluctuation range of 5080-5160.
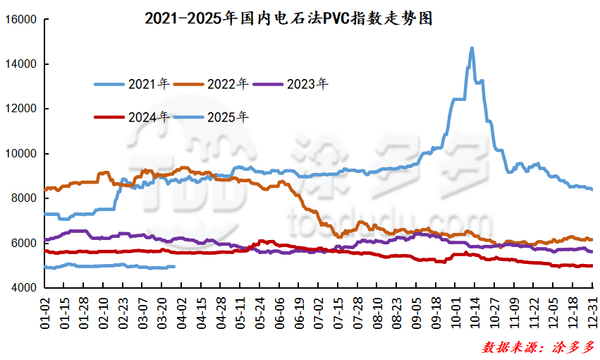
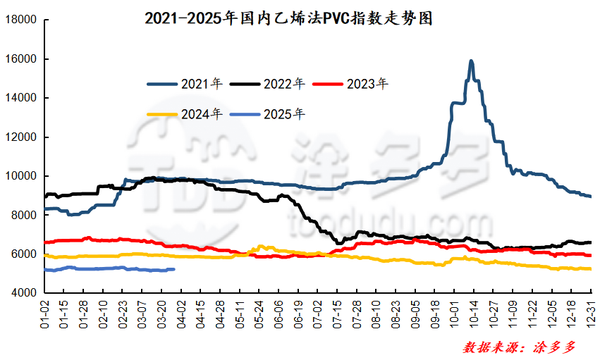
4. Domestic PVC Index
5. This month's PVC (powder) market price
02
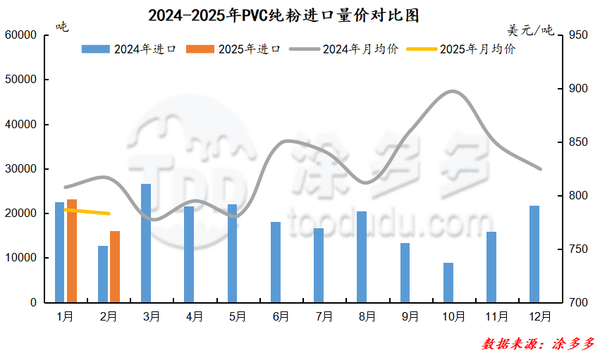
Analysis of PVC Import and Export, Production Volume, and Operating Rate
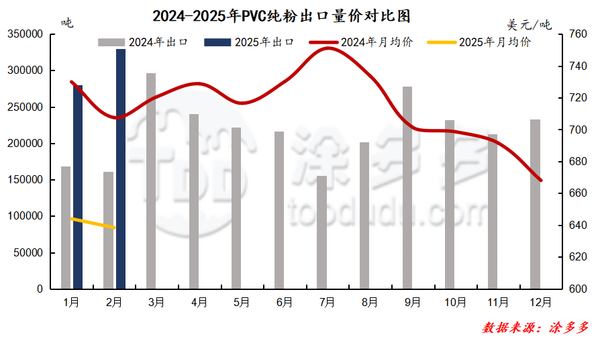
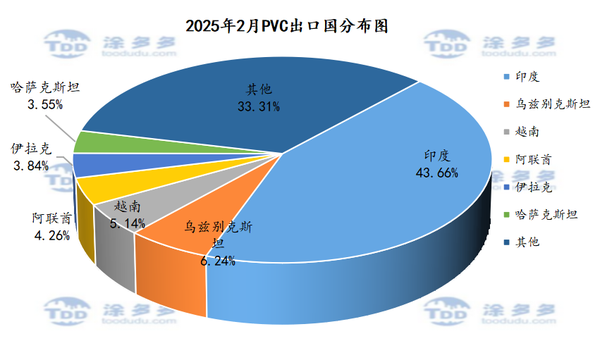
PVC Export Country Analysis: According to the latest statistics, in February 2025, China exported 143,900 tons of PVC to India, accounting for 43.66% of the total export volume; 20,600 tons to Uzbekistan, accounting for 6.24% of the total export volume; and 16,900 tons to Vietnam, accounting for 5.14% of the total export volume.
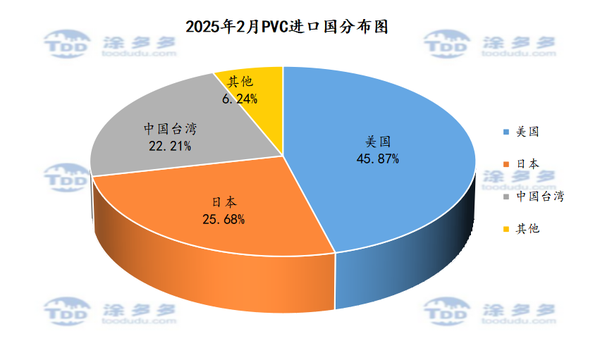
PVC Import Country Analysis: According to the latest statistical data, in February 2025, China imported 7,361.977 tons of PVC from the United States, accounting for 45.87% of the total import volume; imported 4,122.536 tons from Japan, accounting for 25.68% of the total import volume; and imported 3,565.50 tons from Taiwan, accounting for 22.21% of the total import volume.
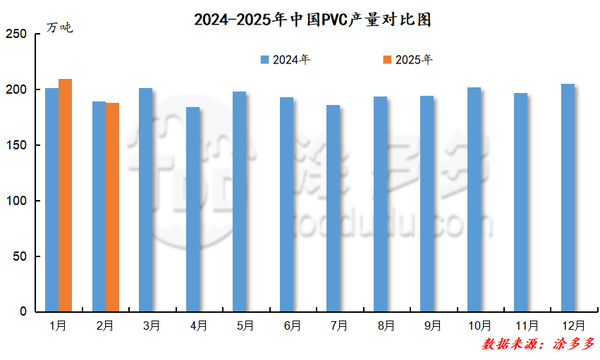
2. PVC Production Analysis
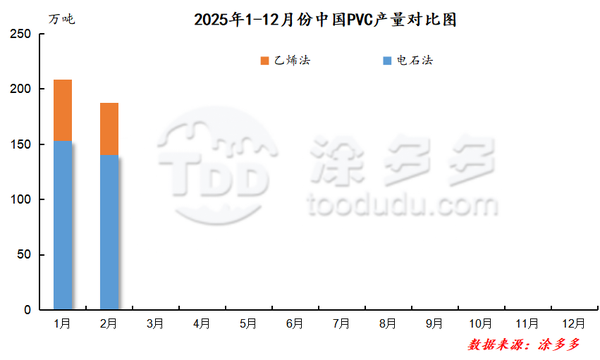
3. PVC Production Classification Analysis
In February 2025, the production of acetylene through the calcium carbide method was 1.408597 million tons, a month-on-month decrease of 8.43%. The cumulative production from January to February through the calcium carbide method was 2.9468 million tons, while the production through the ethylene method was 468,103 tons, a month-on-month decrease of 16.12%. The cumulative production from January to February through the ethylene method was 1.0262 million tons.
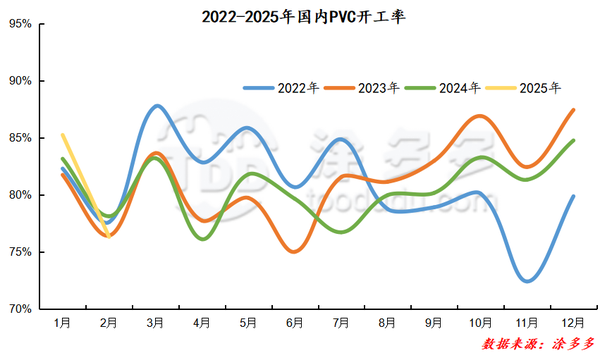
4. PVC Operating Rate Statistics
In February 2025, the domestic PVC operating rate was 76.33%, a year-on-year decrease of 1.81% and a month-on-month decrease of 8.93%.
03
Overview of Production Enterprises' Equipment Status and Maintenance Loss Statistics for This Month
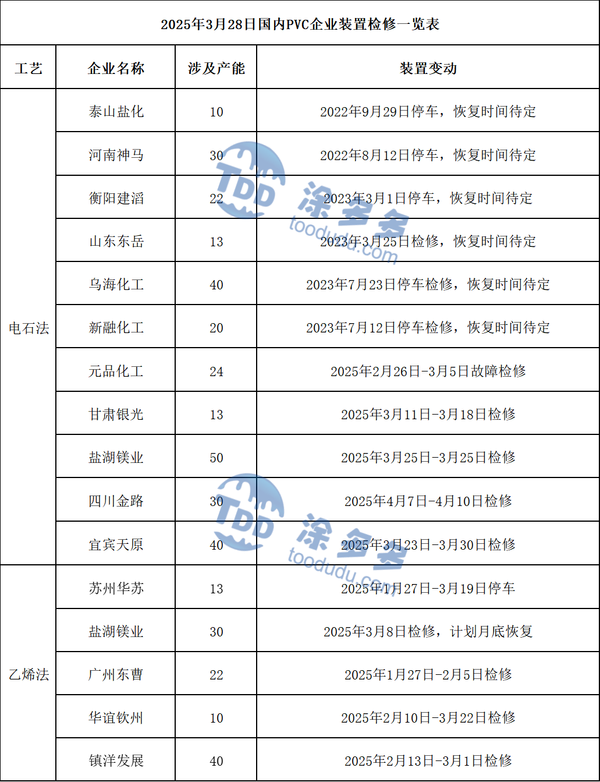
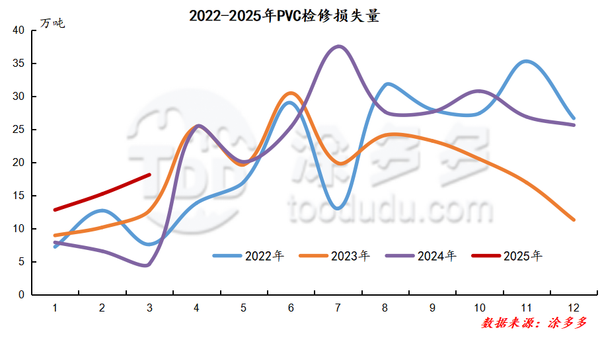
2. Maintenance Loss Statistics
04
Key Analysis of Related Chlor-Alkali Products
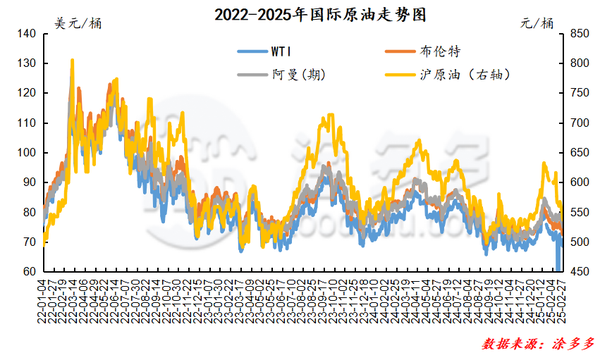
As of March 27, WTI price is $69.92 per barrel, Brent price is $74.03 per barrel, Oman (futures) price is $774.66 per barrel, and Shanghai crude oil is 543.4 yuan per barrel. Compared to the same period last month, WTI has decreased by $0.43 per barrel, Brent has decreased by $0.01 per barrel, Oman (futures) has decreased by $0.29 per barrel, and Shanghai crude oil has increased by 6.8 yuan per barrel.
【Copyright and Disclaimer】The above information is collected and organized by PlastMatch. The copyright belongs to the original author. This article is reprinted for the purpose of providing more information, and it does not imply that PlastMatch endorses the views expressed in the article or guarantees its accuracy. If there are any errors in the source attribution or if your legitimate rights have been infringed, please contact us, and we will promptly correct or remove the content. If other media, websites, or individuals use the aforementioned content, they must clearly indicate the original source and origin of the work and assume legal responsibility on their own.
Most Popular
-

AI Computing Power Demand Ignites Electronic Fabrics! China Jushi Hits Limit Up! Domestic Substitution Welcomes Golden Window
-

Focus on going global! kingfa sci. leads, huitong, preter, and kumho nire follow, china’s modified plastics frenziedly expanding worldwide
-

Back-to-back major joker moves! covestro’s 1.32 million ton mdi dual-line expansion and hdi acquisition reshape global polyurethane landscape
-

Evonik Parts Ways With The Polyester Business! A Strategic Retreat By A Germany Chemical Giant And The Global Industry Shift
-

PA66 Cost and Profit: Broad-Based Weakness in the Feedstock Market Continues to Erode Cost Support for PA66 (202606)


