


Plastic Products Export Increase While Polyolefins Are Constrained by Weak Fundamentals
According to customs statistics, in July 2025, China's total import and export value reached 545.32 billion US dollars, a month-on-month increase of 1.8% and a year-on-year increase of 5.9%. Among them, exports amounted to 321.78 billion US dollars, up 7.2% year-on-year but down 1.0% month-on-month; imports totaled 223.54 billion US dollars, up 4.1% year-on-year and up 6.2% month-on-month; the trade surplus was 98.24 billion US dollars, compared to 114.77 billion US dollars previously. In the first seven months of 2025, the export growth rate was 6.1%. In 2024, the annual export growth rate was 5.9%, the import growth rate was 1.1%, and the trade surplus was 992.16 billion US dollars. Overall, affected by Trump's high tariff policies, although the year-on-year export growth rate for China’s total exports in July increased, the growth rate of export value to the United States continued to decline, and the growth rate of imports from the United States also continued to decrease.
In terms of polyolefin-related products, the export value of plastic products increased year-on-year in July 2025, while the import volume of plastic raw materials in primary forms decreased in price. The export of automobiles, home appliances, and integrated circuits maintained a high growth rate both in quantity and value, with a slight slowdown in home appliance exports on a month-on-month basis. Looking at the domestic and international polyolefin markets, the import arbitrage window for linear PE has closed, while PP maintains a closed import arbitrage window and an open export arbitrage window. In June, polyolefin prices rebounded due to geopolitical factors, but after these factors subsided, prices returned to fundamentals and began to decline. In July, prices rebounded somewhat due to the macro "anti-involution" influence. It is expected that in August, under the influence of weak fundamentals, prices will fluctuate weakly.
The cumulative year-on-year growth rate of total exports to the United States has declined.
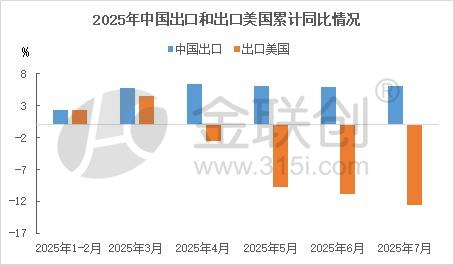
Data Source: General Administration of Customs of China, JLC Reports
In terms of US dollars, China's total export value maintained a positive year-on-year growth in the first half of the year, while the total export value to the United States showed positive growth in the first three months but decreased year-on-year from April to June, with the decline continuing to widen. This indicates that Trump's tariff policy has indeed had a real impact on China's exports to the US. Specifically, in the first five months, China's total export value increased by 6% year-on-year, whereas exports to the US decreased by 9.7%. In the first six months, China's total export value increased by 5.9% year-on-year, while exports to the US decreased by 10.9%. In the first seven months, China's total export value increased by 6.1% year-on-year, whereas exports to the US decreased by 12.6%.
The import volume of primary-shaped plastics has decreased while prices have increased.
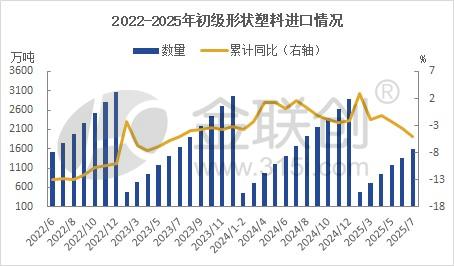
Data Source: General Administration of Customs of China, JLC (Jinlianchuang)
In July 2025, the import volume of plastic raw materials in primary forms was 2.229 million tons, a decrease of 13.2% compared to the same period last year; the import value was 24.1 billion yuan, down 12.2% year-on-year. From January to July 2025, the import volume of plastic raw materials in primary forms was 15.923 million tons, a decrease of 5.0% year-on-year; the import value was 170.51 billion yuan, down 5.6% year-on-year. In January to December 2024, the import volume of plastic raw materials in primary forms was 28.981 million tons, a decrease of 2.1% compared to the same period in 2023; the import value was 311.67 billion yuan, down 2.0% year-on-year. From the perspective of cost support, international crude oil prices declined after mid-January. From May to June, influenced by macro policies and geopolitical factors, oil prices rebounded somewhat, but eventually returned to fundamentals and fell back again, resulting in lower costs for oil-based polyolefins. Due to "anti-involution" measures and supply concerns, domestic coal prices turned upward, causing the profitability of coal-based polyolefins to decrease, but still remain higher than that of oil-based methods. In June, considering polyolefin arbitrage between domestic and overseas markets, the import arbitrage window for linear products closed, the import arbitrage window for PP closed, and the export arbitrage window opened.
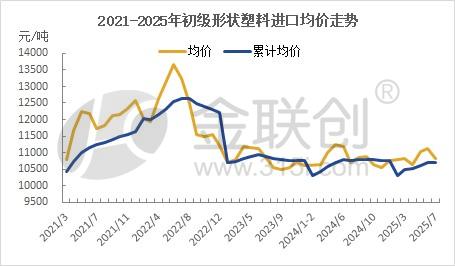
Data source: General Administration of Customs of China, JLC Network
From the perspective of the average monthly price of imported primary-shaped plastic raw materials, the average monthly price reached a new high in June 2022 before starting to decline, and thereafter maintained a continuous downward trend. As shown in the figure, the cumulative average price from January to December 2023 continued to decline. In 2024, prices generally maintained a fluctuating downward trend, with minor variations. The cumulative average price in the first two months of 2025 showed a significant decline due to the continuous drop in international crude oil prices, with a slight increase in March, a renewed decline in April, an increase in May, a continued increase in June, and a noticeable decrease in the average price in July.
The export value of plastic products increased year-on-year.
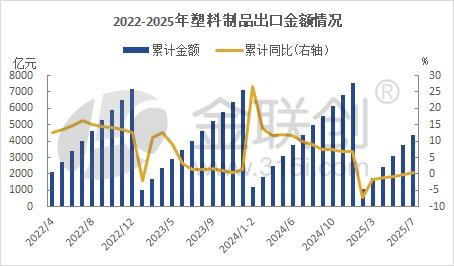
Data source: General Administration of Customs of China, JLC Network Technology
In July 2025, the export value of plastic products was 62.68 billion yuan, a year-on-year increase of 4.1%. From January to July 2025, the export value of plastic products amounted to 438.9 billion yuan, a year-on-year increase of 0.5%. Measured in US dollars, the export value of plastic products from January to July decreased by 0.6% year-on-year. In the first seven months of this year, China's total export value of goods was 2,130.36 billion US dollars, a year-on-year increase of 6.1%, with the growth rate of plastic product exports lagging behind the overall growth rate of national goods exports. In US dollar terms, from January to July, the export values of automobiles, home appliances, and integrated circuits maintained relatively high growth rates, increasing by 9.7%, -0.4%, and 20.5% year-on-year, respectively. Export volumes also maintained double-digit growth rates, increasing by 19.7%, 2.2%, and 20% year-on-year, respectively.
The polyolefin market continues to stumble amid weak fundamentals.
In terms of exports by country, in July, the year-on-year growth rates of China's exports to the United States, the European Union, and ASEAN were -16.13%, 7.59%, and 16.82%, respectively, with changes of 18.39, -4.43, and 1.97 percentage points compared to the previous period. Since April, due to the impact of high tariffs imposed by the U.S. government, China's exports to the United States have significantly declined. Following the high-level Sino-U.S. economic and trade talks in Geneva, the issue of ultra-high tariffs between China and the United States has been alleviated, and the situation of significantly reduced bilateral trade has also improved. In June, China's exports to the United States grew by -16.13% year-on-year, an increase of 18.39 percentage points from the previous month, contributing to the growth of export value this month. Due to the base effect, the growth rate of exports to the European Union slightly declined this month, while exports to ASEAN continued to maintain high growth.
In terms of the domestic polyolefin market fundamentals, capacity expansions are concentrated in the first half of 2025, with supply growth far outpacing demand growth, maintaining a situation of strong supply and weak demand. Polyolefin prices continue to be constrained by the weak fundamental realities. In June, geopolitical factors gradually faded, returning focus to fundamentals. In July, influenced by the domestic macro policy of "anti-involution," prices rebounded somewhat. In August, with no clear positive guidance, prices are expected to fluctuate weakly, although the previous bottom support remains strong.
【Copyright and Disclaimer】The above information is collected and organized by PlastMatch. The copyright belongs to the original author. This article is reprinted for the purpose of providing more information, and it does not imply that PlastMatch endorses the views expressed in the article or guarantees its accuracy. If there are any errors in the source attribution or if your legitimate rights have been infringed, please contact us, and we will promptly correct or remove the content. If other media, websites, or individuals use the aforementioned content, they must clearly indicate the original source and origin of the work and assume legal responsibility on their own.
Most Popular
-

AI Computing Power Demand Ignites Electronic Fabrics! China Jushi Hits Limit Up! Domestic Substitution Welcomes Golden Window
-

Focus on going global! kingfa sci. leads, huitong, preter, and kumho nire follow, china’s modified plastics frenziedly expanding worldwide
-

Back-to-back major joker moves! covestro’s 1.32 million ton mdi dual-line expansion and hdi acquisition reshape global polyurethane landscape
-

Evonik Parts Ways With The Polyester Business! A Strategic Retreat By A Germany Chemical Giant And The Global Industry Shift
-

PA66 Cost and Profit: Broad-Based Weakness in the Feedstock Market Continues to Erode Cost Support for PA66 (202606)


