


[PET Daily Review] Polyester Bottle Chip Market Prices Rise
1 Today's Summary
Mainstream factory prices increased by 50-70, while other factories remained stable. Unit: Yuan/Ton
②. Today's domestic polyester bottle chip capacity utilization rate is 73.37%.
2 Spot Overview
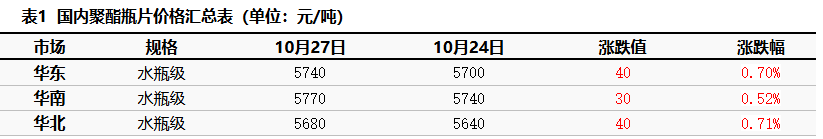
Based on the East China region, today's polyester bottle-grade spot price is 5740, unchanged from the previous working day, basically in line with the morning expectations.
Market reports suggest that raw material PTA and bottle chip companies are about to start anti-involution efforts, benefiting the supply side. Raw material prices have surged significantly, with polyester bottle chip factories following the increase by 50-70, and the market focus has subsequently moved upwards. However, downstream and traders are struggling to keep up with the price hikes, with heard morning transactions at 5650-5700, and an afternoon increase of 50, resulting in a large difference in reported and bid prices, leading to sparse transactions. (Unit: Yuan/ton)
|
Figure 1: 2025 Domestic Polyester Bottle Chip Price Trend Chart (Yuan/Ton) |
Figure 2 Price Trend Chart of Domestic Polyester Bottle Chips in 2025 (Yuan/Ton) |
|
|
|
|
Data source: Longzhong Information |
Data Source: Longzhong Information |
")
")
3. Production Dynamics
Today, the capacity utilization rate of polyester bottle flakes has reached 73.37%. In terms of profit, the price of raw material PTA has risen to 4490, MEG price remains stable at 4183, polymerization cost has increased by 34.36 to 5258.22, and the profit for polyester bottle flakes is a loss of 18.22 yuan/ton.
|
Figure 3: Trend Chart of Domestic Polyester Bottle Chip Capacity Utilization Rate for 2024-2025 |
Figure 4: Comparison of Profit and Price of Domestic Polyester Bottle Chips in 2025 (CNY/Ton) |
|
|
|
|
Data source: Longzhong Information |
Data source: Longzhong Information |
")
")
4. Market Sentiment
Table 2 Domestic Polyester Bottle Chip Upstream and Downstream Practitioners' Sentiment Expectations (Updated on Monday)
|
Viewpoint |
Quantity |
Proportion |
Month-on-month |
|
Bullish |
5 |
20% |
8% |
|
Bearish |
12 |
48% |
-12% |
|
Flat |
8 |
32% |
4% |
5. Price Forecast
From the supply perspective, new installations are about to start production, contributing effective output in November, but increasing pressure on the supply side. From the demand perspective, entering the off-season, downstream performance is weak, and the consumption of raw materials is slow. Temporarily supported by news, the polyester bottle chip market may maintain a relatively strong pattern. It is expected that tomorrow the spot price of polyester bottle chip water bottle material in the East China region will run within the range of 5700-5800 yuan/ton.
6. Relevant Product Information
PTA Market: East China market PTA prices are organized, with negotiation reference around 4450. This week and next week, main port delivery offers are 01 at a discount of 75-80, with counter-offers at a discount of 80-82 for negotiated transactions. For mid to late November, offers are 01 at a discount of 65-70, with counter-offers at a discount of 70-75 for negotiated transactions. The sentiment in the sector is weak, with absolute prices showing a weak adjustment in the morning. The increase in supply is putting pressure on the market, and insufficient maintenance due to low processing fees is also a factor. As a result, market participants are feeling pressure, leading to limited actual negotiations. (Unit: yuan/ton)
MEG marketToday, the ethylene glycol market showed signs of strengthening. In the morning, the spot price in Zhangjiagang opened around 4155. During the day, the price slightly improved due to some companies announcing maintenance plans for November. In the afternoon, macroeconomic factors boosted a general rebound in commodities, pushing the ethylene glycol spot price above 4200. However, there was insufficient buying interest to follow the rise, and by the afternoon close, the spot price fell back to the 4183-4185 range for negotiations, with the spot basis weakening. In the morning, it was in the 01+80 to 01+83 range. The South China market saw a stalemate between buyers and sellers with low transaction volume.
7. Data Calendar
Table 3 Overview of Domestic Polyester Bottle Chip Data (Unit: 10,000 tons, %)
|
Data |
Release Date |
Last period data |
This period's trend forecast. |
|
Capacity Utilization Rate |
Weekday 17:00 |
73.37% |
→ |
|
Weekly Production |
Thursday 5:00 PM |
33.51 |
→ |
|
Weekly Capacity Utilization Rate |
Thursday 5:00 PM |
73.37% |
→ |
|
Data source: Longzhong Information Remarks: 1 Consider significant fluctuations as those with changes greater than 3%, highlighting the data dimensions with such increases or decreases. 2 Consider narrow fluctuations as those with a price change within 0-3%. |
|||
【Copyright and Disclaimer】The above information is collected and organized by PlastMatch. The copyright belongs to the original author. This article is reprinted for the purpose of providing more information, and it does not imply that PlastMatch endorses the views expressed in the article or guarantees its accuracy. If there are any errors in the source attribution or if your legitimate rights have been infringed, please contact us, and we will promptly correct or remove the content. If other media, websites, or individuals use the aforementioned content, they must clearly indicate the original source and origin of the work and assume legal responsibility on their own.
Most Popular
-

AI Computing Power Demand Ignites Electronic Fabrics! China Jushi Hits Limit Up! Domestic Substitution Welcomes Golden Window
-

Focus on going global! kingfa sci. leads, huitong, preter, and kumho nire follow, china’s modified plastics frenziedly expanding worldwide
-

PA66 Cost and Profit: Broad-Based Weakness in the Feedstock Market Continues to Erode Cost Support for PA66 (202606)
-

Back-to-back major joker moves! covestro’s 1.32 million ton mdi dual-line expansion and hdi acquisition reshape global polyurethane landscape
-

Evonik Parts Ways With The Polyester Business! A Strategic Retreat By A Germany Chemical Giant And The Global Industry Shift


