


Perspective on Polyt’s Semi-Annual Report: 43.94% Net Profit Growth Driven by Production Capacity Expansion
As the domestic modified plastics market moves forward under pressure, industry leader PRET delivered an impressive report card for the first half of 2025.
The secret behind its net profit growth of 43.94% year-on-year has long been hidden in its production bases spread across the globe and newly established factories.
1. Proactive Capacity Deployment Strategy
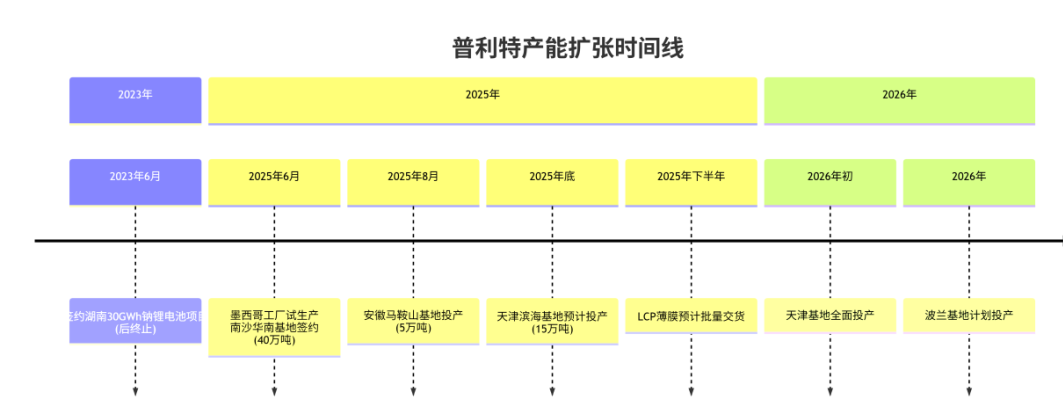
Recently, Polestar inCapacity expansionFrequent actions in various aspects, the company is...Modified materials fieldContinuously expand production capacity.
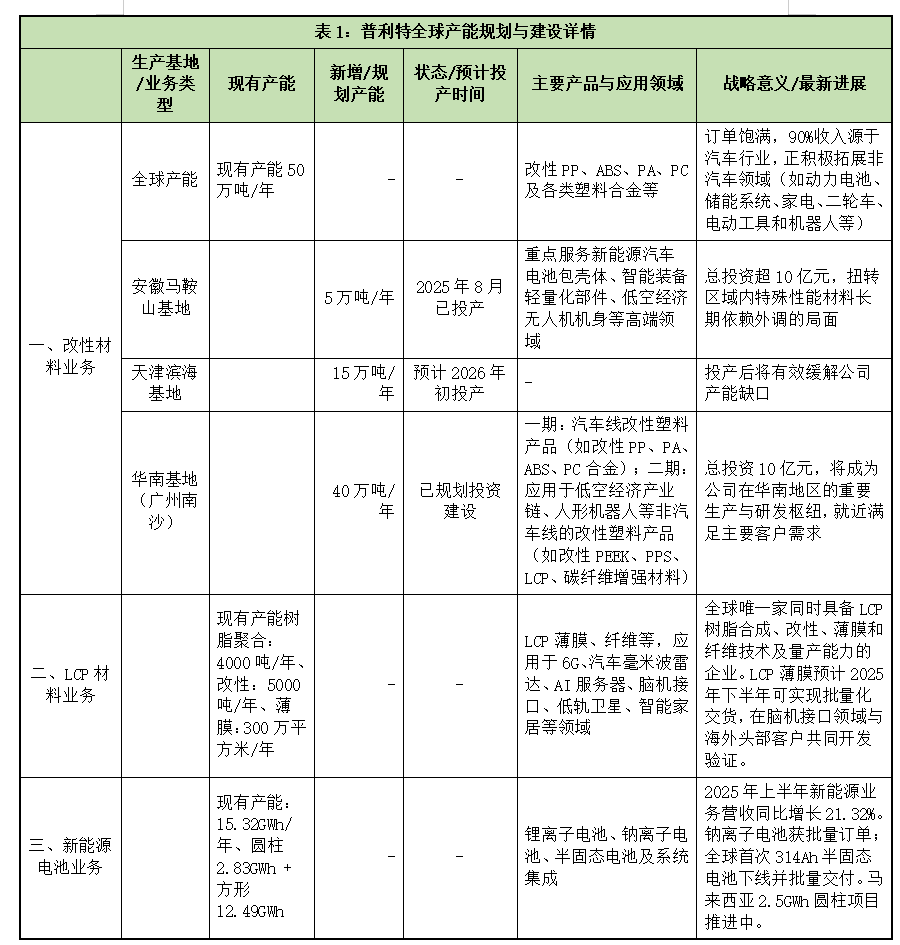
It is reported that there are currently ... established worldwide.12 new material production and manufacturing basesIncluding3 under construction Distributed in Qingpu, Shanghai; Jinshan, Shanghai; Jiaxing, Zhejiang; Tongliang, Chongqing; Wuhan, Hubei; Foshan, Guangdong; Binhai, Tianjin; South Carolina, USA; Chonburi, Thailand; and Monterrey, Mexico.
Current companyExisting production capacity is 500,000 tons.The ongoing projects include the Prett South China Headquarters and R&D Production and Manufacturing Base Project with an expected annual capacity of 400,000 tons, and a new materials factory in Ma'anshan, Anhui, with an expected capacity of 50,000 tons, which is about to start production. The new materials factory in Binhai, Tianjin, with an expected capacity of 150,000 tons, is expected to start production in early 2026.The expected future annual production capacity will exceed 1 million tons.。
2. Overview of Performance in the First Half of 2025
Based on the financial data released by Pret for the first half of 2025, it is not difficult to identify the logic behind its active efforts to expand global production capacity.
Pritt achieves in the first half of 2025.Total operating income: 4,089.7786 million RMB,Year-on-year growth of 9.06%ImplementNet profit attributable to shareholders is 207.29 million yuan.,Increased by 43.94% compared to the same period last year.
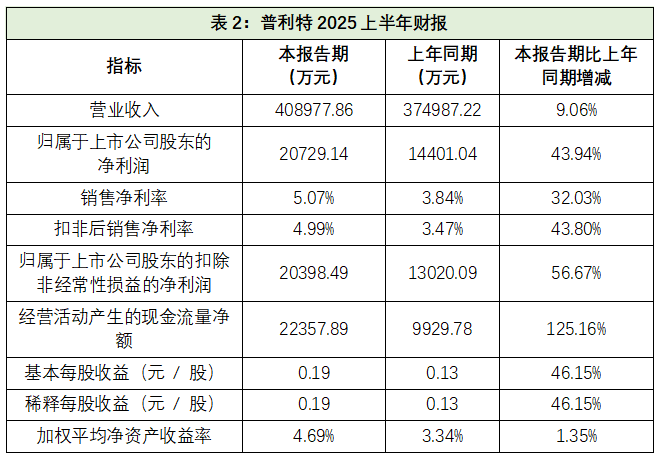
Overall, the financial data for the first half of 2025 shows thatThe overall positive trend.
It is worth noting that the net profit in the first half of 2025 has increased year-on-year.43.94%The main growth drivers are attributed to the coordinated growth across various sectors, as can be seen from the following two charts:
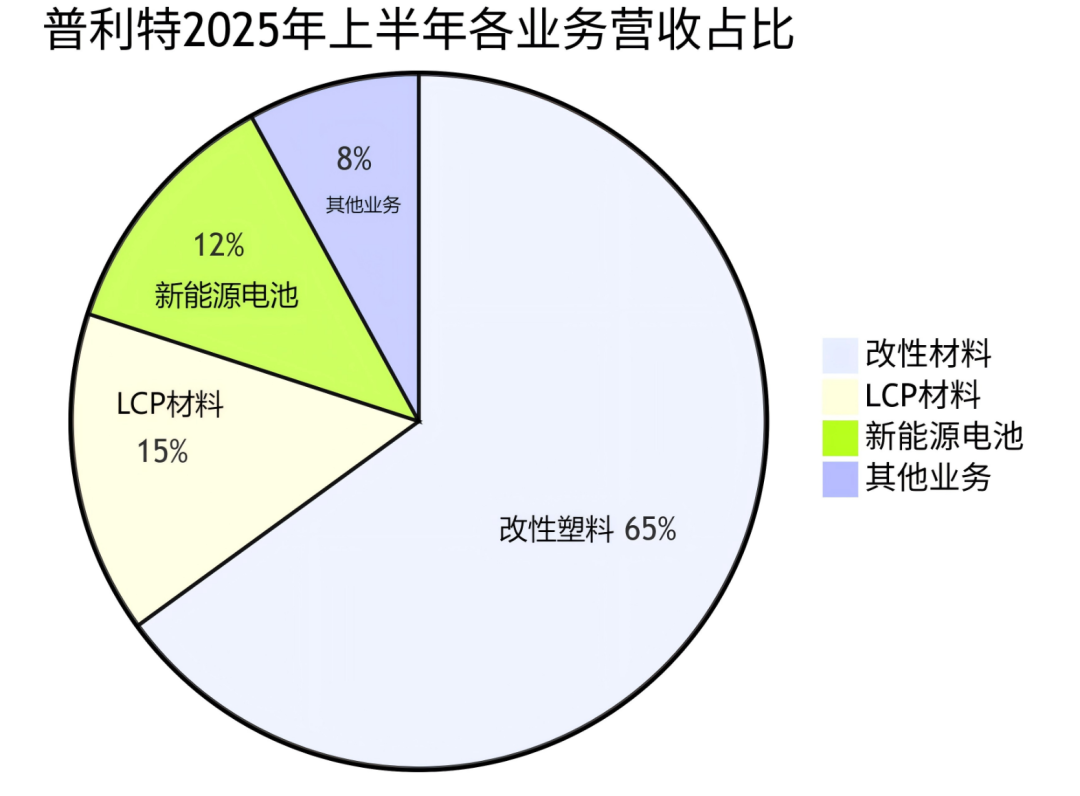
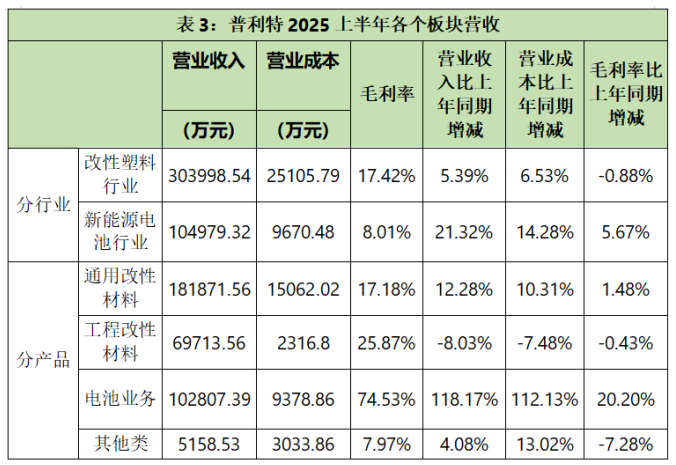
It can be clearly seen from the figure:
Modified materials are the company's foundation and ballast.With the highest revenue contribution (about 65%), its stable double-digit growth has provided a solid foundation for overall profits.
New Energy Battery BusinessWith a considerable revenue proportion (about 25%) and a rapid growth rate, it is an important incremental contributor.
LCP materialsAlthough the current revenue share is small, it is growing at an astonishing rate (about 50%) and is a new growth pole with great potential.
3. Cause Analysis
Pret’s rapid development in recent years is closely linked to its long-standing commitment to the strategy of “internal and external improvement, dual-wheel drive.” Now, the company has gradually...The transformation of traditional modified plastics enterprises follows a development path of "deep modification—functional materials—platform technology."The evolution trend.
In the short term, the successive commissioning of new production capacities in Anhui, Tianjin, and other regions is expected to further strengthen their advantages in the field of modified materials, providing stable support for overall performance.
In the medium term, the application of LCP films in consumer electronics (such as AI smartphone antennas) is gradually expanding, while the promotion of sodium batteries and semi-solid-state batteries in the energy storage market is expected to create new growth drivers.
In terms of long-term planning, the company is also conducting materials research and validation in cutting-edge technology fields such as brain-computer interfaces and low Earth orbit satellites, gradually building platform capabilities to provide material solutions for high-tech applications.
4. Future Prospects
By steadily advancing global capacity layout and optimizing product structure, Polynt is expected to achieve more balanced development in terms of profitability and growth potential.
In the context of the current industry transformation, the company is gradually expanding by leveraging strategic patience and technological accumulation."New Materials + New Energy"This path also reflects that manufacturing enterprises need to continuously drive technological innovation and enhance their position in the value chain in order to better seize future growth opportunities.
【Copyright and Disclaimer】The above information is collected and organized by PlastMatch. The copyright belongs to the original author. This article is reprinted for the purpose of providing more information, and it does not imply that PlastMatch endorses the views expressed in the article or guarantees its accuracy. If there are any errors in the source attribution or if your legitimate rights have been infringed, please contact us, and we will promptly correct or remove the content. If other media, websites, or individuals use the aforementioned content, they must clearly indicate the original source and origin of the work and assume legal responsibility on their own.
Most Popular
-

AI Computing Power Demand Ignites Electronic Fabrics! China Jushi Hits Limit Up! Domestic Substitution Welcomes Golden Window
-

Focus on going global! kingfa sci. leads, huitong, preter, and kumho nire follow, china’s modified plastics frenziedly expanding worldwide
-

PA66 Cost and Profit: Broad-Based Weakness in the Feedstock Market Continues to Erode Cost Support for PA66 (202606)
-

Back-to-back major joker moves! covestro’s 1.32 million ton mdi dual-line expansion and hdi acquisition reshape global polyurethane landscape
-

Evonik Parts Ways With The Polyester Business! A Strategic Retreat By A Germany Chemical Giant And The Global Industry Shift


