


Peak Season Turns into a Bubble! Imbalanced Supply and Demand Coupled with Decreased Costs, PC Prices Plunge by 700 Yuan in a Single Month!
Entering 2025, the domestic PC industry's capacity utilization rate has significantly increased and remained at a high level. With an extremely high base of domestic production capacity, domestic PC output has reached a new level; however, at the same time, overall downstream consumption is weak. Only the modified industry showed strong order placement and procurement before the Spring Festival, while other industries stopped work and took holidays earlier. Since after the Spring Festival holiday, all major consumer industries have shown a rather sluggish trend, with order placement and procurement rhythms greatly slowing down. The spot trading of PC has always been unsmooth, and the pressure of imbalance between production and sales in the industry has been increasing day by day, with market negotiation focuses continuously declining. However, due to the strong cost support brought by the high position of upstream raw materials in the industrial chain, the decline in the price of domestically produced PC was relatively limited in the early stage. Since mid-March, domestic PC supply has remained high, and there has also been a significant drop in the prices of many upstream raw materials. The pressure on the PC market has become more severe, and the overall decline has noticeably widened, reaching a new low since the second half of 2020.
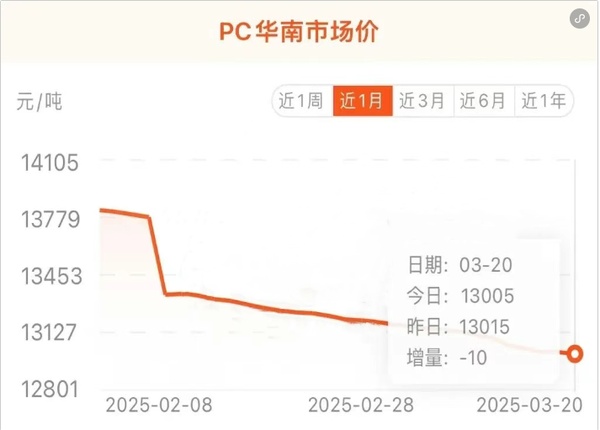
March domestic PC market price changes
This week, domestic PC factory and spot market prices have both significantly declined. Among them, the ex-factory price of a certain PC factory in Shandong has been adjusted to below 12,000 yuan/ton, breaking its two-month-long sideways trend, while the ex-factory prices of other domestic PC factories have also been reduced by varying degrees, with adjustments ranging from 200 to 250 yuan/ton; Zhejiang Petrochemical's auction opened low and then closed at a premium, showing a decline of 200 yuan/ton compared to last week; in terms of the spot market, the price of domestically produced materials in the East China market has generally fallen below 12,500 yuan/ton, representing a drop of more than 1% compared to early March, and a decrease of around 3% compared to February 5 (the first working day after the Spring Festival).
The main reasons for the recent expansion of the decline in the domestic PC market are as follows:
Supply remains at an extremely high level, and the pressure from the imbalance between production and sales in the industry continues to increase.
Domestic PC weekly capacity utilization trend chart
![[隆众聚焦]:供需失衡叠加成本下降,3月中旬国内PC市场跌幅扩大](https://oss.plastmatch.com/zx/image/12df4cc86eb34511976950c87a4da7df.png "[隆众聚焦]:供需失衡叠加成本下降,3月中旬国内PC市场跌幅扩大")
In 2025, the capacity utilization rate of the domestic PC industry reached new highs. According to Longzhong Information data, by March 2025, the total capacity of the domestic PC industry remained at 3.81 million tons/year, stable from the end of 2024. In January, the average capacity utilization rate of the industry was 78.60%, which jumped to a high of 81.55% in February. Entering March, it further increased, with the average weekly capacity utilization rate in the first half of the month exceeding 85%, and the weekly output approaching the 70,000-ton mark. The continuous growth in supply is an inevitable result of the high degree of integration in the PC industry chain, and it has had an adverse impact on the fragile market, being the main factor driving the continuous decline in market conditions.
In addition, before the Spring Festival, many downstream industries of PC stop work and take holidays earlier. After the festival, the start of downstream demand is slower than expected, and there is no improvement even entering March. Moreover, against the backdrop of a highly sufficient industry supply, the limited rigid demand from downstream buyers is also more hesitant and negative, which has a great adverse effect on market transactions.
2.3 In March, the overall decline in upstream raw materials was significant, with expectations of increased cost transmission.
Table 2 PC and Upstream Raw Material Price Change Statistics Table
unit: USD/barrel, CNY/ton
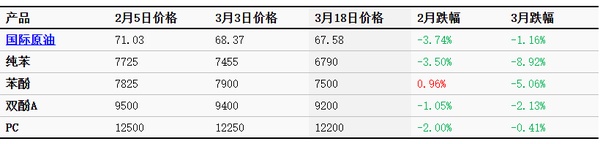
In March, the sharp decline in international crude oil prices had a significant impact on the prices of chemical raw materials. The upstream pure benzene in the industrial chain began to rapidly decrease in price, and phenol and bisphenol A also followed with varying degrees of decline, weakening the cost support for PC. As of the close on March 18, the prices of pure benzene, phenol, and bisphenol A in East China were 6790 yuan/ton, 7500 yuan/ton, and 9200 yuan/ton, respectively, with declines ranging from 2.13% to 8.92% compared to early March. Among them, the upstream pure benzene saw the largest decline, benefiting downstream products in the industrial chain, while bisphenol A experienced the smallest decline, with its profitability significantly improving compared to February. However, based on the supply and demand situation, expectations for further price declines have increased, which is unfavorable for stabilizing the bottom of the PC market.
In late March to April, a weak consolidation remains the main theme of the domestic PC market. Despite one production line of Luxi Chemical's PC facility continuing to be shut down in late March, the overall operation of other domestic PC facilities remained stable. In April, although there are scheduled maintenance plans for the PC facilities of Pingmei Shenma, Cangzhou Dahua, and Sino-Saudi Tianjin, the industry's overall capacity utilization rate will drop to around 75% for a period. However, the positive effect on supply has not yet been seen. The key to whether market sentiment can be boosted after experiencing an extended period of price declines lies in the sustainability of reduced supply and the genuine improvement in market transactions brought about by the recovery of downstream demand.
【Copyright and Disclaimer】The above information is collected and organized by PlastMatch. The copyright belongs to the original author. This article is reprinted for the purpose of providing more information, and it does not imply that PlastMatch endorses the views expressed in the article or guarantees its accuracy. If there are any errors in the source attribution or if your legitimate rights have been infringed, please contact us, and we will promptly correct or remove the content. If other media, websites, or individuals use the aforementioned content, they must clearly indicate the original source and origin of the work and assume legal responsibility on their own.
Most Popular
-

AI Computing Power Demand Ignites Electronic Fabrics! China Jushi Hits Limit Up! Domestic Substitution Welcomes Golden Window
-

Focus on going global! kingfa sci. leads, huitong, preter, and kumho nire follow, china’s modified plastics frenziedly expanding worldwide
-

PA66 Cost and Profit: Broad-Based Weakness in the Feedstock Market Continues to Erode Cost Support for PA66 (202606)
-

Back-to-back major joker moves! covestro’s 1.32 million ton mdi dual-line expansion and hdi acquisition reshape global polyurethane landscape
-

Evonik Parts Ways With The Polyester Business! A Strategic Retreat By A Germany Chemical Giant And The Global Industry Shift


