


PE Pipe: Price Hits 5-Year Low! 2025 Market Trend Analysis
[Introduction]:From January to August 2025, the market prices of PE pipes were all lower than the same period in previous years, with the fluctuation range being narrower than in past years, overall showing a trend of weak oscillation. There were also instances of temporary price increases. Under the phased influences of macroeconomic factors, costs, and supply and demand, the price trend in 2025 exhibited phenomena that broke seasonal patterns during multiple time periods, with the pressure from demand noticeably intensifying.
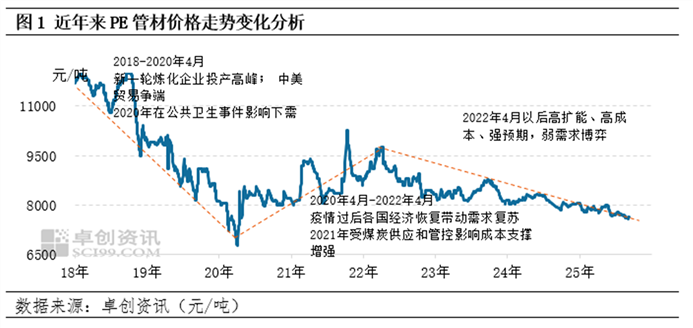
From 2018 to 2025, the market price of PE pipes generally shows an inverted "N" trend. In 2020, due to the impact of public health events, poor recovery in demand, and the sharp drop in crude oil prices, the market price fell to a nearly five-year low of 6,750 yuan/ton in early April 2020. Subsequently, as downstream demand gradually recovered and upstream raw material crude oil prices repeatedly rose, cost support strengthened, reaching a high point of 9,800 yuan/ton in mid-October 2021. Following this, with the gradual release of production from new capacity installations and the slow recovery of demand, PE pipe prices began to decline. From 2023 to 2025, prices are heavily influenced by policy guidance, with strong expectations and weak reality in a long-term state of contention. Additionally, with the commissioning of previous PE pipe installations, pressure on the supply side continues to increase, and prices maintain a low-level oscillation.
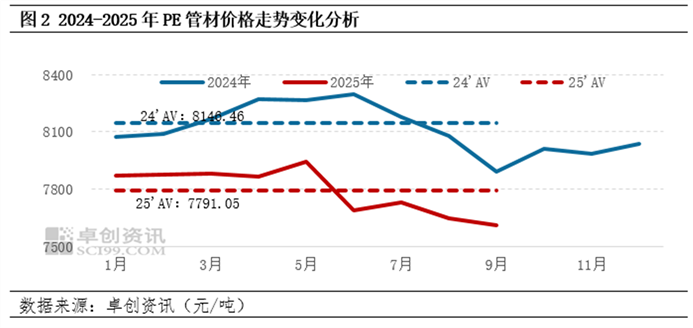
From January to August 2025, the market price of PE pipes remained below the levels of previous years during the same period, with price fluctuations narrowing compared to previous years. Taking the price of YGH041 from Sinopec Shanghai Petrochemical in East China as an example, the average price from January to August 2025 was 7,791.05 yuan/ton, down 4.36% from the same period last year. The price peaked in May and bottomed out in August, with a fluctuation range of 440 yuan/ton, compared to 500 yuan/ton last year, indicating an overall narrowing of price volatility. Overall, the price of PE pipes from January to August 2025 showed a trend of fluctuating weakness, though there were brief periods of price increases. These price rises were mainly driven by the combined effects of three factors: firstly, the sustained implementation of macroeconomic policies provided effective support to the market; secondly, the high international crude oil prices led to a cost-push effect; and thirdly, there were market benefits from periodic supply shortages. On the other hand, price declines were primarily due to two constraining factors: on the one hand, the recovery in demand fell short of expectations, resulting in a gap between actual and anticipated demand; on the other hand, the periodic oversupply in the market led to sluggish inventory reduction, creating supply-side pressure that had a clear suppressive effect on spot market prices.
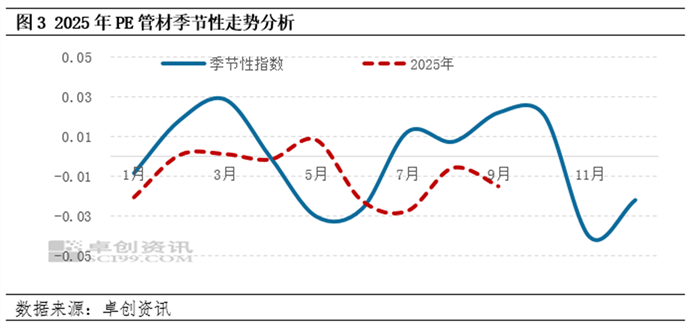
Based on the seasonal patterns over the past five years, the months of February to March and November to December typically experience month-on-month increases, while the months from July to October usually see month-on-month declines. The peaks occur in March and October, and the troughs occur in May to June and November.
In 2025, certain periods within the year broke the seasonal pattern. In May, an off-season price increase occurred, mainly driven by positive macroeconomic news and strengthened support from crude oil costs, along with enhanced supply support. These factors collectively boosted the pipe market, resulting in month-on-month price increases. However, in July and August, as well as early September, the market experienced an off-season price decline. During this period, although the incremental supply was limited and overall pressure was not significant, the traditional demand off-season and weak actual demand recovery caused market participants to adopt a cautious mindset. Downstream buyers maintained low-price, just-needed purchases, and transactions failed to expand, suppressing spot market activity. From July to September, the downward price trend was difficult to reverse, remaining in a continuous decline phase.
【Copyright and Disclaimer】The above information is collected and organized by PlastMatch. The copyright belongs to the original author. This article is reprinted for the purpose of providing more information, and it does not imply that PlastMatch endorses the views expressed in the article or guarantees its accuracy. If there are any errors in the source attribution or if your legitimate rights have been infringed, please contact us, and we will promptly correct or remove the content. If other media, websites, or individuals use the aforementioned content, they must clearly indicate the original source and origin of the work and assume legal responsibility on their own.
Most Popular
-

AI Computing Power Demand Ignites Electronic Fabrics! China Jushi Hits Limit Up! Domestic Substitution Welcomes Golden Window
-

Focus on going global! kingfa sci. leads, huitong, preter, and kumho nire follow, china’s modified plastics frenziedly expanding worldwide
-

Back-to-back major joker moves! covestro’s 1.32 million ton mdi dual-line expansion and hdi acquisition reshape global polyurethane landscape
-

Evonik Parts Ways With The Polyester Business! A Strategic Retreat By A Germany Chemical Giant And The Global Industry Shift
-

PA66 Cost and Profit: Broad-Based Weakness in the Feedstock Market Continues to Erode Cost Support for PA66 (202606)


