


[PE Daily Review] Narrow Price Fluctuations Supported by Downstream Rigid Demand
1. Today's Summary
OPEC+'s planned production increase for October is relatively moderate, and the risk of U.S. sanctions against some oil-producing countries remains, leading to a rise in international oil prices. NYMEX crude oil futures for October settled at $62.26 per barrel, up $0.39 or 0.63% week-on-week; ICE Brent crude oil futures for November settled at $66.02 per barrel, up $0.52 or 0.79% week-on-week.
②、 The price change range in the HDPE market is -4 to 3 yuan/ton, in the LDPE market -2 yuan/ton, and in the LLDPE market -1 yuan/ton.
2. Spot Market Overview
Table 1 Domestic Polyethylene Closing Price Summary Table (Unit: Yuan) /ton)
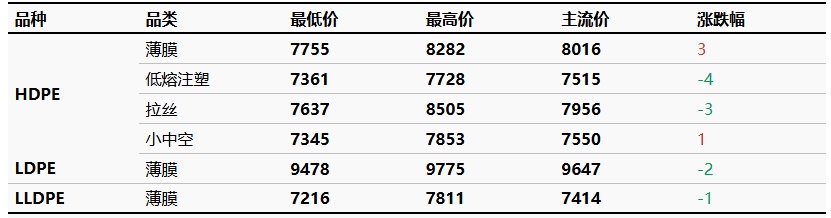
Support from the raw material side remains, and production enterprises have increased maintenance of equipment, resulting in a reduction in output. However, downstream peak season orders have not been fulfilled, leading to weakened market confidence. Today's transactions are maintained at just-needed levels. The market price change for HDPE is -4 to 3 yuan/ton, for LDPE is -2 yuan/ton, and for LLDPE is -1 yuan/ton.
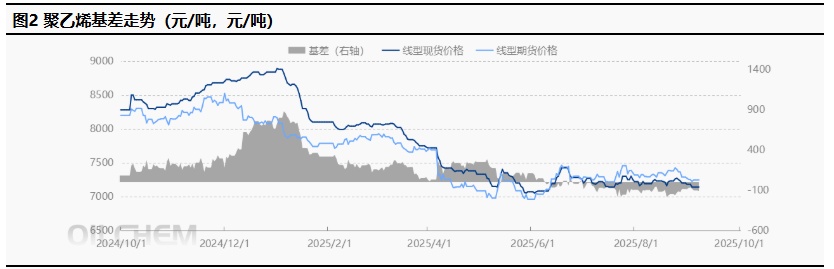
3 translates to "spot-futures basis" in English.
The LL main contract fluctuated downward, opening at 7,248 yuan/ton and closing at 7,229 yuan/ton by 15:00, remaining stable compared to the previous settlement price. The trading volume was 165,800 lots, and the open interest was 518,000 lots. Today's futures-spot basis was 7,150 yuan/ton, compared to the previous working day's +7,261 yuan/ton.
4 Production Dynamics
Capacity utilization rate from The percentage changed from 78.25% to 78.17%. The cost of oil-based production is 7,452 yuan/ton; the oil-based profit is -202 yuan/ton; the coal-based profit is 962 yuan/ton.
|
Graph 3 Domestic Polyethylene Capacity Utilization Trend |
Figure 4 Comparison of Domestic Polyethylene Profit and Price (Yuan) /ton) |
![[PE日评]:下游刚需支撑,价格窄幅波动(20250909)](https://oss.plastmatch.com/zx/image/484eb1e880c44d41998e32179a510a95.png "[PE日评]:下游刚需支撑,价格窄幅波动(20250909)") |
![[PE日评]:下游刚需支撑,价格窄幅波动(20250909)](https://oss.plastmatch.com/zx/image/d2adea9bf09b4e558422c21988d18a99.png "[PE日评]:下游刚需支撑,价格窄幅波动(20250909)") |
|
Data Source: Longzhong Information |
Data source: Longzhong Information |
5 Market sentiment
Table 2 Domestic Polyethylene Upstream and Downstream Industry Participants' Sentiment and Expectations
|
Date |
Bearish |
Bullish |
Steady look |
|
This week |
16.8% |
16.3% |
66.8% |
|
Last week |
17.8% |
18.8% |
63.4% |
|
Rise and fall |
-1.0% |
-2.5% |
3.5% |
|
Data source: Longzhong Information |
|||
|
Note: The above data is updated every Thursday. |
|||
6. Price Prediction
In the short term, On the supply side, inventory pressure is easing. On the demand side, downstream gradually enters the traditional peak season, but downstream enterprises still have certain inventory, and order growth is not significant, mainly maintaining rigid demand. Therefore, it is expected that the polyethylene market will experience narrow fluctuations tomorrow. 。
7. Relevant Product Information
Crude Oil Market: The main trading logic of the international crude oil market has not changed. The bullish factors include the continuation of U.S. sanctions policy on oil-producing countries and uncertainties in geopolitical situations, while the bearish factors are OPEC+ maintains its stance on production increases, and the global economy remains weak. The production increase by OPEC+ is smaller than expected, providing limited suppression to oil prices. Currently, the situation between the United States and Venezuela, as well as the Russia-Ukraine and Israel-Palestine conflicts, remains unstable. Geopolitical tensions have strengthened support for oil prices, and it is expected that... Bright International oil prices are expected to show a slight upward trend.
8. Data Calendar
Table 3 Domestic Polyethylene Data Overview Table (Unit: Ten Thousand Tons)
|
Data |
Publication Date |
Previous period data |
This period's trend is expected |
|
Total Inventory of PE Production Enterprises (10,000 tons) |
Wednesday 17:00PM |
45.08 |
↘ |
|
PE Social Sample Warehouse Inventory |
Tuesday 17:00PM |
-0.27% |
↘ |
|
Weekly PE Production (10,000 tons) |
Thursday 17:00PM |
63.25 |
↗ |
|
PE maintenance impact volume (10,000 tons) |
Thursday 17:00PM |
12.33 |
↘ |
|
PE Weekly Capacity Utilization Rate |
Thursday 17:00PM |
80.55% |
↗ |
|
Capacity Utilization Rate of Downstream Industries in PE |
Thursday 17:00PM |
0.80% |
↗ |
|
PE Mentality Survey |
Thursday 12:00AM |
-0.99% |
↘ |
|
Data Source: Longzhong Information Remarks: 1. ↓↑ are regarded as significant fluctuations, highlighting data dimensions with a price change exceeding 3%. 2. ↗↘ are regarded as narrow fluctuations, highlighting data with changes within the range of 0-3%. The above data is updated every Thursday. |
|||
【Copyright and Disclaimer】The above information is collected and organized by PlastMatch. The copyright belongs to the original author. This article is reprinted for the purpose of providing more information, and it does not imply that PlastMatch endorses the views expressed in the article or guarantees its accuracy. If there are any errors in the source attribution or if your legitimate rights have been infringed, please contact us, and we will promptly correct or remove the content. If other media, websites, or individuals use the aforementioned content, they must clearly indicate the original source and origin of the work and assume legal responsibility on their own.
Most Popular
-

AI Computing Power Demand Ignites Electronic Fabrics! China Jushi Hits Limit Up! Domestic Substitution Welcomes Golden Window
-

Focus on going global! kingfa sci. leads, huitong, preter, and kumho nire follow, china’s modified plastics frenziedly expanding worldwide
-

Back-to-back major joker moves! covestro’s 1.32 million ton mdi dual-line expansion and hdi acquisition reshape global polyurethane landscape
-

Evonik Parts Ways With The Polyester Business! A Strategic Retreat By A Germany Chemical Giant And The Global Industry Shift
-

PA66 Cost and Profit: Broad-Based Weakness in the Feedstock Market Continues to Erode Cost Support for PA66 (202606)


