


[pe daily review] market sentiment weakens, price center of gravity slightly shifts downward
1. Today's Summary
OPEC+ may continue to significantly increase production in September, leading traders to take profits and causing international oil prices to fall. NYMEX crude oil futures for the September contract fell by $0.74/barrel to $69.26, a decrease of 1.06% compared to the previous period; ICE Brent crude futures for the September contract fell by $0.71/barrel to $72.53, a decrease of 0.97% compared to the previous period.
②、 The HD PE market price change range is -5 to -6 yuan/ton, the LDPE market price is -1 yuan/ton, and the LLDPE market price is -7 yuan/ton.
2. Spot Overview
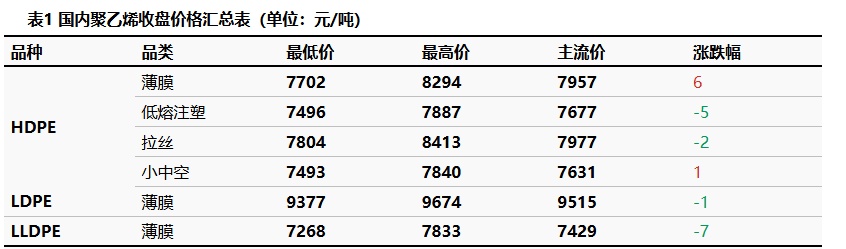
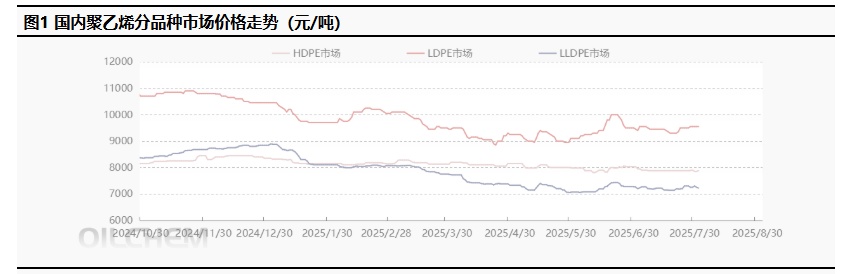
Macro messages have been gradually digested, with no further boost, and support from the cost side has weakened. The spot market is relatively well-supplied, with slight concessions made to facilitate transactions, leading to a downward shift in price focus and weak trading. Currently, the market is driven by macro sentiment, with a relatively strong mentality. However, from a fundamental perspective, there is no significant improvement in supply, and pressure remains, while the demand side is recovering slowly, making it difficult to generate effective upward momentum. Therefore, a slight consolidation is expected to be the main trend. The HDPE market price fluctuated by -5 to 6 yuan/ton, the LDPE market price by -1 yuan/ton, and the LLDPE market price by -7 yuan/ton.
3 ========: Basis
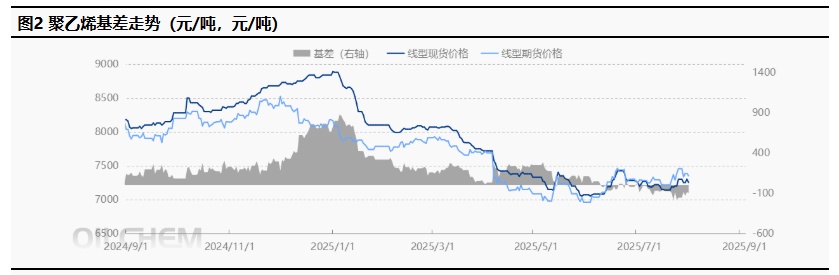
The main LL contract fluctuated downward, opening at 7,344 yuan/ton. By 15:00, the closing price was 7,317 yuan/ton, a decrease of 52 yuan compared to the previous settlement price. The trading volume was 220,500 contracts, and the open interest was 313,100 contracts, a decrease of 13,800 contracts. Today's futures-spot basis was -97 yuan/ton, an increase of 3 yuan/ton compared to the previous working day.
4 Production Dynamics
Capacity utilization rate by The change from 80.38% to 82.59%. The cost of oil production is 8035 yuan/ton; the profit from oil production is -685 yuan/ton; the profit from coal production is 1010 yuan/ton.
|
Graph 3 Domestic Polyethylene Capacity Utilization Trend |
Graph 4 Comparison of Domestic Polyethylene Profit and Price (Yuan) /ton) |
![[PE日评]:市场情绪转弱,价格重心小幅下移(20250801)](https://oss.plastmatch.com/zx/image/863710c57aba4c4b9f9df6b994d4fbb9.png "[PE日评]:市场情绪转弱,价格重心小幅下移(20250801)") |
![[PE日评]:市场情绪转弱,价格重心小幅下移(20250801)](https://oss.plastmatch.com/zx/image/bb2eec14f8f540869f94670b13820b7e.png "[PE日评]:市场情绪转弱,价格重心小幅下移(20250801)") |
|
Data source: Longzhong Information |
Data Source: Longzhong Information |
5 Market sentiment
Table Sentiment Expectations of Domestic Polyethylene Upstream and Downstream Practitioners
|
Date |
Bearish |
Bullish |
Steady look |
|
This week |
26.7% |
15.8% |
57.4% |
|
Last week |
32.2% |
5.0% |
62.9% |
|
Rise and fall |
-5.5% |
10.9% |
-5.4% |
|
Data Source: Longzhong Information |
|||
|
Note: The above data is updated every Thursday. |
|||
6. Price Forecast
Short-term During the off-season, the rebound in demand is limited, and downstream purchasing volume is not large, maintaining only necessary demand. The impact of the news is gradually dissipating, and the market atmosphere is turning dull. Therefore Next week Polyethylene Market Price Fluctuating downward Mainly.
7. Related Product Information
Crude Oil Market: The main trading logic of the international crude oil market has not changed. The positive factors come from the continuation of U.S. sanctions policies against oil-producing countries and the ongoing traditional peak consumption season in the U.S., while the negative factor is the easing of geopolitical tensions compared to earlier periods. OPEC+ maintains its stance on increasing production amid a weak global economy. Today, some economic data from Europe and the United States will be released in quick succession. Based on the expected values, they may still show signs of weakness. Coupled with the market's attention starting in early August on OPEC+'s production increase plan for September, it is anticipated that... Tomorrow International oil prices will show Decline Situation.
8. Data Calendar
Table 3 Domestic Polyethylene Data Overview Table (Unit: 10,000 Tons)
|
Data |
Release Date |
Previous Data |
The trend for this period is expected |
|
PE Production Enterprise Total Inventory (10,000 tons) |
Wednesday 17:00PM |
43.28 |
↘ |
|
PE Social Sample Warehouse Inventory |
Tuesday 17:00PM |
1.79% |
↗ |
|
PE Weekly Production (10,000 tons) |
Thursday 17:00PM |
63.55 |
↗ |
|
PE Maintenance Impact Volume (10,000 tons) |
Thursday 17:00PM |
9.14 |
↘ |
|
PE Weekly Capacity Utilization Rate |
Thursday 17:00PM |
81.97% |
↗ |
|
PE downstream industry capacity utilization rate |
Thursday 17:00PM |
0.31% |
↗ |
|
PE Mindset Survey |
Thursday 12:00AM |
10.89% |
↗ |
|
Data source: Longzhong Information Note: 1. Consider a significant fluctuation as a substantial rise or fall, highlighting data dimensions with a change exceeding 3%. 2. ↗↘ are considered narrow fluctuations, highlighting data with a rise or fall within 0-3%. The above data is updated every Thursday. |
|||
【Copyright and Disclaimer】The above information is collected and organized by PlastMatch. The copyright belongs to the original author. This article is reprinted for the purpose of providing more information, and it does not imply that PlastMatch endorses the views expressed in the article or guarantees its accuracy. If there are any errors in the source attribution or if your legitimate rights have been infringed, please contact us, and we will promptly correct or remove the content. If other media, websites, or individuals use the aforementioned content, they must clearly indicate the original source and origin of the work and assume legal responsibility on their own.
Most Popular
-

AI Computing Power Demand Ignites Electronic Fabrics! China Jushi Hits Limit Up! Domestic Substitution Welcomes Golden Window
-

Focus on going global! kingfa sci. leads, huitong, preter, and kumho nire follow, china’s modified plastics frenziedly expanding worldwide
-

Back-to-back major joker moves! covestro’s 1.32 million ton mdi dual-line expansion and hdi acquisition reshape global polyurethane landscape
-

Evonik Parts Ways With The Polyester Business! A Strategic Retreat By A Germany Chemical Giant And The Global Industry Shift
-

PA66 Cost and Profit: Broad-Based Weakness in the Feedstock Market Continues to Erode Cost Support for PA66 (202606)


