


[PE Daily Review] Market Confidence Weakens, Low-Price Transactions Dominate
1. Today's Summary
The Russia-Ukraine conflict continues to raise market concerns about potential supply risks, coupled with the possibility of the Federal Reserve initiating interest rate cuts, leading to an increase in international oil prices. Crude oil futures The October contract rose by $1.22/barrel to $64.52, a month-on-month increase of +1.93%; the ICE Brent crude futures November contract rose by $1.03/barrel to $68.47, a month-on-month increase of +1.53%.
②、 The market price of HDPE has changed by -1 to -3 yuan/ton, LDPE market price increased by 2 yuan/ton, and LLDPE market price decreased by 2 yuan/ton.
2. Spot Overview
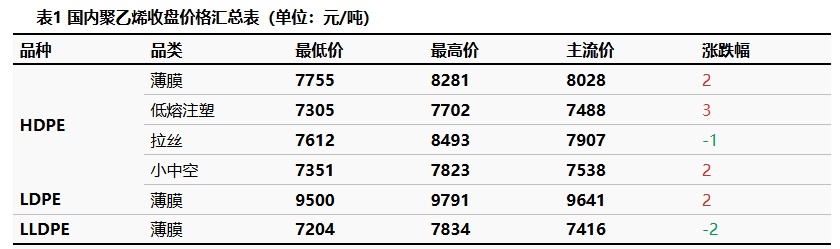
The macroeconomic support has strengthened, but the operating conditions of downstream factories are below expectations, resulting in insufficient market confidence. Market offers have tentatively increased, with transactions mainly occurring at low prices. The HDPE market price fluctuated between -1 to +3 yuan/ton, the LDPE market price increased by 2 yuan/ton, and the LLDPE market price decreased by 2 yuan/ton.
3 Spot-Futures Basis
The main contract of LL futures fluctuated upwards, opening at 7,199 yuan/ton. As of 15:00, the closing price was 7,232 yuan/ton, an increase of 58 yuan/ton compared to the previous settlement price. The trading volume was 264,000 contracts, and the open interest was 555,000 contracts. Today's futures-spot basis was -75 yuan/ton, an increase of 9 yuan/ton compared to the previous working day.
4 Production dynamics
The capacity utilization rate of The percentage changed from 80.4% to 79.5%. The oil-based production cost is 7,635 yuan/ton; the oil-based profit is -385 yuan/ton; the coal-based profit is 871 yuan/ton.
|
Figure 3 Trend of Domestic Polyethylene Capacity Utilization Rate |
Figure 4 Comparison of Domestic Polyethylene Profit and Price (Yuan) (per ton) |
") |
") |
|
Data Source: Longzhong Information |
Data Source: Longzhong Information |
5 Market sentiment
Table 2 Sentiment and Expectations of Domestic Polyethylene Upstream and Downstream Practitioners
|
Date |
Bearish |
Bullish |
Look steady |
|
This week |
18.8% |
19.3% |
61.9% |
|
Last week |
16.8% |
16.3% |
66.8% |
|
Rise and fall |
2.0% |
3.0% |
-5.0% |
|
Data Source: Longzhong Information |
|||
|
Note: The above data is updated every Thursday. |
|||
6. Price Prediction
In the short term, with the National Day holiday approaching, downstream restocking activities have led to a slight increase in demand, which is still weaker than expected. On the supply side, recent domestic polyethylene supply has decreased, alleviating some pressure. Therefore, it is expected that polyethylene prices will mainly fluctuate within a narrow range tomorrow.
7. Information on Related Products
Crude Oil Market: The main trading logic of the international crude oil market has not changed. The positive factors come from the continuation of U.S. sanctions on oil-producing countries and geopolitical uncertainties, while the negative factors are... OPEC+ maintains its stance on increasing production, and the global economy is underperforming. The Russia-Ukraine conflict remains tense, raising market concerns about a potential short-term reduction in Russian oil supply. Coupled with the instability in the Israel-Palestine situation, it is expected that international oil prices will show an upward trend tomorrow.
8. Data Calendar
Table 3 Domestic Polyethylene Data Overview Table (Unit: 10,000 tons)
|
Data |
Publication Date |
Previous Data |
This period's trend forecast |
|
Total Inventory of PE Production Enterprises (10,000 tons) |
Wednesday 17:00PM |
48.70 |
↗ |
|
PE Social Sample Warehouse Inventory |
Tuesday 17:00PM |
-0.04% |
↘ |
|
PE Weekly Production (10,000 tons) |
Thursday 17:00PM |
61.28 |
↗ |
|
PE maintenance impact (ten thousand tons) |
Thursday 17:00PM |
14.62 |
↘ |
|
PE Weekly Capacity Utilization Rate |
Thursday 17:00PM |
78.04% |
↗ |
|
PE downstream industry capacity utilization rate |
Thursday 17:00PM |
1.11% |
↗ |
|
PE Mindset Research |
Thursday 12:00AM |
2.97% |
↗ |
|
Data source: Longzhong Information Remarks: 1. ↓↑ are considered significant fluctuations, highlighting data dimensions with a change of more than 3%. 2. ↗↘ are considered narrow fluctuations, highlighting data with changes within the range of 0-3%. The above data is updated every Thursday. |
|||
【Copyright and Disclaimer】The above information is collected and organized by PlastMatch. The copyright belongs to the original author. This article is reprinted for the purpose of providing more information, and it does not imply that PlastMatch endorses the views expressed in the article or guarantees its accuracy. If there are any errors in the source attribution or if your legitimate rights have been infringed, please contact us, and we will promptly correct or remove the content. If other media, websites, or individuals use the aforementioned content, they must clearly indicate the original source and origin of the work and assume legal responsibility on their own.
Most Popular
-

AI Computing Power Demand Ignites Electronic Fabrics! China Jushi Hits Limit Up! Domestic Substitution Welcomes Golden Window
-

Focus on going global! kingfa sci. leads, huitong, preter, and kumho nire follow, china’s modified plastics frenziedly expanding worldwide
-

PA66 Cost and Profit: Broad-Based Weakness in the Feedstock Market Continues to Erode Cost Support for PA66 (202606)
-

Back-to-back major joker moves! covestro’s 1.32 million ton mdi dual-line expansion and hdi acquisition reshape global polyurethane landscape
-

Evonik Parts Ways With The Polyester Business! A Strategic Retreat By A Germany Chemical Giant And The Global Industry Shift


