


[PE Daily Review] Macro Support Still Exists, Prices Fluctuate
1. Today's Summary
①. The United States and the European Union have reached a new trade agreement, and the U.S. will shorten the deadline for new sanctions against Russia, leading to an increase in international oil prices. NYMEX crude oil futures for the September contract rose by $1.55 per barrel to $66.71, a month-on-month increase of +2.38%; ICE Brent crude futures for the September contract rose by $1.60 per barrel to $70.04, a month-on-month increase of +2.34%.
②、The market price of HDPE changed by -10 to -3 yuan/ton, the market price of LDPE increased by 2 yuan/ton, and the market price of LLDPE increased by 1 yuan/ton.
2. Overview of Spot Market
Table 1 Domestic Polyethylene Closing Price Summary Table (Unit: Yuan) (tons)
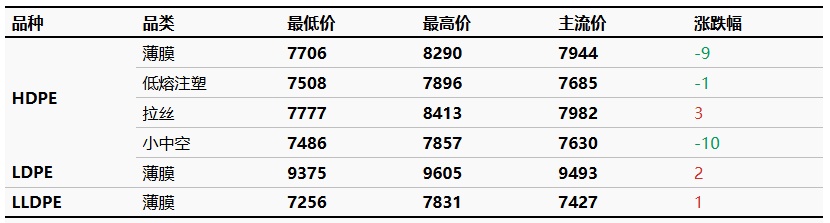
From the current cost perspective, the support from crude oil costs is acceptable. On the supply and demand side, the pressure on supply continues to increase as maintenance units gradually start up and new units are commissioned. On the demand side, downstream demand is gradually recovering, with some enterprises engaging in restocking activities. Although macroeconomic support is strong, the marginal improvement in supply and demand is limited. The price change range for the HDPE market is -10 to -3 yuan/ton, the LDPE market price is +2 yuan/ton, and the LLDPE market price is +1 yuan/ton.
3 Futures-cash basis
The main LL contract fluctuated downward, opening at 7,341 yuan/ton. As of 15:00, the closing price was 7,385 yuan/ton, 18 yuan higher than the previous settlement price. Trading volume was 239,700 lots, with an open interest of 343,600 lots, down by 2,781 lots. Today's futures basis was -135 yuan/ton, compared to -50 yuan/ton on the previous trading day.
4 Production Updates
Capacity utilization rate from The change from 80.52% to 81.01%. The oil-based production cost is 7,815 yuan/ton; the oil-based profit is -465 yuan/ton; the coal-based profit is 1,238 yuan/ton.
|
Graph 3 Domestic Polyethylene Capacity Utilization Trend |
Figure 4 Domestic Polyethylene Profit and Price Comparison (Yuan) (per ton) |
![[PE日评]:宏观支撑仍存,价格涨跌均现(20250729)](https://oss.plastmatch.com/zx/image/262c02c51c974db1a6fef061ed98218a.png "[PE日评]:宏观支撑仍存,价格涨跌均现(20250729)") |
![[PE日评]:宏观支撑仍存,价格涨跌均现(20250729)](https://oss.plastmatch.com/zx/image/a4addf12de234ac2af4740c954263153.png "[PE日评]:宏观支撑仍存,价格涨跌均现(20250729)") |
|
Data Source: Longzhong Information |
Data Source: Longzhong Information |
5 Market sentiment
Table 2 Sentiment and Expectations of Domestic Polyethylene Upstream and Downstream Practitioners
|
Date |
Bearish |
Bullish |
Steady look |
|
This week |
32.2% |
5.0% |
62.9% |
|
last week |
46.0% |
0.5% |
53.5% |
|
Rise and Fall |
-13.9% |
4.5% |
9.4% |
|
Data Source: Longzhong Information |
|||
|
Note: The above data is updated every Thursday. |
|||
6. Price Forecast
Short-term Overall demand remains weak, with limited downstream purchasing and only essential needs being met. In the short term, the market may be influenced by news, leading to a slight price rebound and an improvement in market sentiment. Therefore Tomorrow Polyethylene Market Price Oscillation Mainly.
7. Relevant Product Information
Crude Oil Market: The main trading logic in the international crude oil market has not changed. The positive factors come from the continuation of U.S. sanctions on oil-producing countries and the extension of the traditional U.S. consumption peak season, while the negative factor is the easing of geopolitical tensions compared to the previous period. OPEC+ maintains its stance on increasing production amid a sluggish global economy. The new trade agreement between the US and the EU has alleviated market concerns. Additionally, new US sanctions against Russia may come as early as early to mid-August, increasing potential supply risks. Tomorrow International oil prices will show an upward trend.
8. Data Calendar
Table 3 Domestic Polyethylene Data Overview Table (Unit: 10,000 Tons)
|
Data |
Release Date |
Previous period data |
This period's trend forecast |
|
Total Inventory of PE Production Enterprises (10,000 tons) |
Wednesday 17:00PM |
50.29 |
↘ |
|
PE Social Sample Warehouse Inventory |
Tuesday 17:00PM |
4.07% |
↗ |
|
Weekly PE Production (10,000 tons) |
Thursday 17:00PM |
61.51 |
↗ |
|
PE Maintenance Impact Volume (10,000 tons) |
Thursday 17:00PM |
11.35 |
↘ |
|
PE Weekly Capacity Utilization Rate |
Thursday 17:00PM |
79.83% |
↗ |
|
Capacity Utilization Rate of Downstream Industries in PE |
Thursday 17:00PM |
-0.09% |
↘ |
|
PE Mentality Survey |
Thursday 12:00AM |
-13.86% |
↘ |
|
Data source: Longzhong Information Remarks: 1. Consider a significant fluctuation as a swing up or down, highlighting data dimensions with a change exceeding 3%. 2. ↗↘ are regarded as narrow fluctuations, highlighting data with price changes within the 0-3% range. The above data is updated every Thursday. |
|||
【Copyright and Disclaimer】The above information is collected and organized by PlastMatch. The copyright belongs to the original author. This article is reprinted for the purpose of providing more information, and it does not imply that PlastMatch endorses the views expressed in the article or guarantees its accuracy. If there are any errors in the source attribution or if your legitimate rights have been infringed, please contact us, and we will promptly correct or remove the content. If other media, websites, or individuals use the aforementioned content, they must clearly indicate the original source and origin of the work and assume legal responsibility on their own.
Most Popular
-

AI Computing Power Demand Ignites Electronic Fabrics! China Jushi Hits Limit Up! Domestic Substitution Welcomes Golden Window
-

Focus on going global! kingfa sci. leads, huitong, preter, and kumho nire follow, china’s modified plastics frenziedly expanding worldwide
-

PA66 Cost and Profit: Broad-Based Weakness in the Feedstock Market Continues to Erode Cost Support for PA66 (202606)
-

Back-to-back major joker moves! covestro’s 1.32 million ton mdi dual-line expansion and hdi acquisition reshape global polyurethane landscape
-

Evonik Parts Ways With The Polyester Business! A Strategic Retreat By A Germany Chemical Giant And The Global Industry Shift


