


PE Daily Review: Enterprises Reduce Prices to Deplete Inventory, Downstream Demand for Essential Purchases
1. Today's Summary
1. The Israeli-Palestinian sides have reached a ceasefire agreement, and the instability of the geopolitical situation has eased, leading to a decline in international oil prices. NYMEX crude oil futures for November are at $61.51, down $1.04 per barrel, a decrease of 1.66%; ICE Brent crude futures for December are at $65.22, down $1.03 per barrel, a decrease of 1.55%.
②、 The price fluctuation range for the HDPE market is -28 to 4 yuan/ton, the LDPE market price is -16 yuan/ton, and the LLDPE market price is -20 yuan/ton.
2. Spot Overview
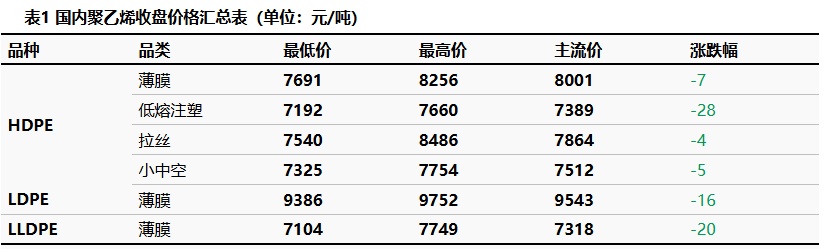
Recently, the arrival of imported resources has increased, leading to an accumulation of domestic inventory. Orders are maintained on a just-needed basis, and industry insiders hold a rather pessimistic view of the market outlook. The focus is primarily on offering discounts to reduce inventory. The price fluctuation range for the HDPE market is -28 to 4 yuan/ton, the market price for LDPE is -16 yuan/ton, and the market price for LLDPE is -20 yuan/ton.
3
The main LL contract fluctuated downward, opening at 7,075 yuan/ton. As of 15:00, the closing price was 7,037 yuan/ton, down 36 yuan/ton compared to the previous settlement price. The trading volume was 225,100 lots, and the open interest was 557,900 lots. Today's futures-spot basis was -17 yuan/ton, up 10 yuan/ton from the previous working day.
4 Production Dynamics
Capacity utilization is The change from 75.37% to 74.44%. The cost of oil production is 7,387 yuan/ton; the oil production profit is -237 yuan/ton; the coal production profit is 602 yuan/ton.
|
Figure 3 Domestic polyethylene capacity utilization trend |
Figure 4 Domestic polyethylene profit and price comparison (yuan) /ton) |
") |
") |
|
Data Source: Longzhong Information |
Data Source: Longzhong Information |
5 Market sentiment
Table 2. Sentiment Expectations of Domestic Polyethylene Upstream and Downstream Practitioners
|
Date |
Bearish |
Bullish |
Steady watching |
|
This week |
25.7% |
5.9% |
68.3% |
|
Last week |
20.3% |
9.4% |
70.3% |
|
Rise and Fall |
5.4% |
-3.5% |
-2.0% |
|
Data Source: Longzhong Information |
|||
|
Note: The above data is updated every Thursday. |
|||
6. Price Prediction
In the short term, the cost support of crude oil for polyethylene is limited. On the supply side, both imported resources and domestic production show an increasing trend, leading to greater supply pressure. On the demand side, downstream orders mainly maintain just-in-time inventory replenishment. Overall, it is expected that in the short term, the polyethylene market price may undergo a weak adjustment, with a magnitude of... 10-50 yuan/ton.
7. Related Product Information
Crude Oil Market: In the short term, the main trading logic of the international crude oil market has not changed. The positives come from the continuation of U.S. sanctions policies against oil-producing countries and geopolitical uncertainties, while the negatives are OPEC+ maintains its stance on increasing production amid poor global economic conditions. The easing situation between Israel and Palestine is still a market focus, and coupled with OPEC+'s firm position on production increases, international oil prices are expected to show a downward trend tomorrow.
8. Data Calendar
Table 3 Domestic Polyethylene Data Overview Table (Unit: 10,000 tons)
|
Data |
Publication Date |
Previous Data |
Current Trend Forecast |
|
PE Production Enterprises Total Inventory (10,000 tons) |
Wednesday 17:00PM |
45.83 |
↘ |
|
PE social sample warehouse inventory |
Tuesday 17:00PM |
-2.17% |
↘ |
|
PE Weekly Production (10,000 tons) |
Thursday 17:00PM |
64.26 |
↗ |
|
PE maintenance impact volume (ten thousand tons) |
Thursday 17:00PM |
11.37 |
↘ |
|
PE Weekly Capacity Utilization Rate |
Thursday 17:00PM |
81.84% |
↗ |
|
PE downstream industry capacity utilization rate |
Thursday 17:00PM |
1.21% |
↗ |
|
PE Mindset Survey |
Thursday 12:00AM |
-13.36% |
↗ |
|
Data Source: Longzhong Information Note: 1. ↓↑ are considered significant fluctuations, highlighting data dimensions with a change of more than 3%. 2. ↗↘ is considered a narrow fluctuation, highlighting data with a rise or fall within the range of 0-3%. The above data is updated every Thursday. |
|||
【Copyright and Disclaimer】The above information is collected and organized by PlastMatch. The copyright belongs to the original author. This article is reprinted for the purpose of providing more information, and it does not imply that PlastMatch endorses the views expressed in the article or guarantees its accuracy. If there are any errors in the source attribution or if your legitimate rights have been infringed, please contact us, and we will promptly correct or remove the content. If other media, websites, or individuals use the aforementioned content, they must clearly indicate the original source and origin of the work and assume legal responsibility on their own.
Most Popular
-

AI Computing Power Demand Ignites Electronic Fabrics! China Jushi Hits Limit Up! Domestic Substitution Welcomes Golden Window
-

Focus on going global! kingfa sci. leads, huitong, preter, and kumho nire follow, china’s modified plastics frenziedly expanding worldwide
-

PA66 Cost and Profit: Broad-Based Weakness in the Feedstock Market Continues to Erode Cost Support for PA66 (202606)
-

Back-to-back major joker moves! covestro’s 1.32 million ton mdi dual-line expansion and hdi acquisition reshape global polyurethane landscape
-

Evonik Parts Ways With The Polyester Business! A Strategic Retreat By A Germany Chemical Giant And The Global Industry Shift


