


Pe daily review: Abundant Supply Leads to Declining Transaction Prices
1. Today's Summary
1. The U.S. softened its rhetoric on imposing additional tariffs, combined with the ongoing Russia-Ukraine conflict that continues to pose potential supply risks, leading to an increase in international oil prices. The NYMEX crude oil futures for the November contract rose by $0.59 per barrel to $59.49, a 1.00% increase from the previous period; ICE Brent crude futures for the December contract rose by $0.59 per barrel to $63.32, a 0.94% increase from the previous period.
②、 The HD PE market price change range is -21 to -5 yuan/ton, the LDPE market price is -34 yuan/ton, and the LLDPE market price is -27 yuan/ton.
2. Spot Overview
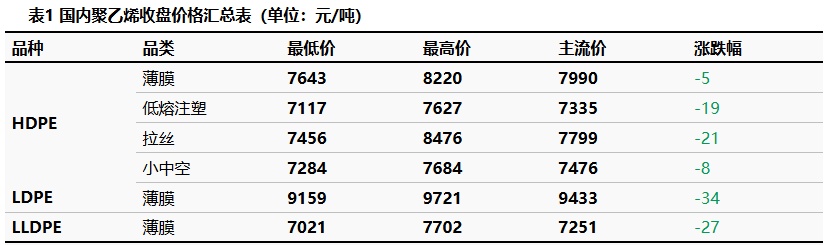
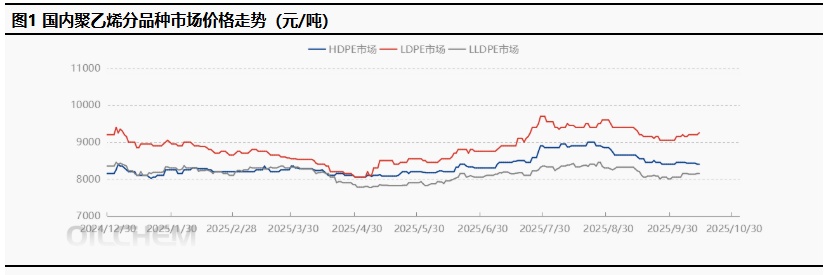
The current polyethylene market is amply supplied, with downstream factories mostly purchasing as needed. Traders, in order to alleviate inventory pressure, tend to offer discounts to facilitate sales, leading to a decline in actual transaction prices. Although seasonal demand, such as for agricultural films, provides some support to the market, the overall supply pressure remains significant against the backdrop of continued release of new production capacity, and the rate of social inventory reduction is below expectations. The HDPE market price fluctuation range is -21 to -5 yuan/ton, LDPE market price is -34 yuan/ton, LLDPE market price is -27 yuan/ton.
3 ========
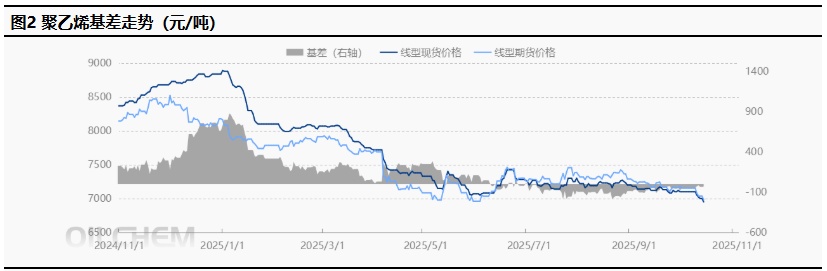
The main LL contract fluctuated downwards, opening at 6,996 yuan/ton. As of 15:00, the closing price was 6,918 yuan/ton, down 87 yuan/ton from the previous settlement price. The trading volume was 266,300 lots, and the open interest was 577,100 lots. Today's futures-spot basis was 22 yuan/ton, an increase of 55 yuan/ton compared to the previous working day.
4 Production Dynamics
Capacity utilization by 81.1% changed to 81.2%. The oil-based production cost is 7,239 yuan/ton; the oil-based profit is -139 yuan/ton; the coal-based profit is 422 yuan/ton.
|
Figure 3 Domestic Polyethylene Capacity Utilization Trend |
Figure 4 Domestic Polyethylene Profit and Price Comparison (Yuan /ton) |
") |
") |
|
Data source: Longzhong Information |
Data Source: Longzhong Information |
5 Market sentiment
Table 2. Sentiment Expectations of Domestic Polyethylene Upstream and Downstream Practitioners
|
Date |
Bearish |
Bullish |
Steady Look |
|
This week |
25.7% |
5.9% |
68.3% |
|
Last week |
20.3% |
9.4% |
70.3% |
|
Rise and fall |
5.4% |
-3.5% |
-2.0% |
|
Data Source: Longzhong Information |
|||
|
Note: The above data is updated every Thursday. |
|||
6. Price Forecast
The current polyethylene market is experiencing significant supply pressure. After the holiday, domestic facilities that were previously under maintenance are gradually resuming operations. Additionally, new production capacities are planned to be released, and the concentration of imported resources arriving at ports has further exacerbated the pressure on the supply side. On the demand side, downstream factories are generally cautious in their purchasing behavior, mainly restocking as needed, providing limited support to the market. Considering both supply and demand factors, it is expected that the polyethylene market prices will show a weak consolidation trend tomorrow, with the operating range possibly being in. 10-50 yuan/ton fluctuation.
7. Related Product Information
Crude Oil Market: In the short term, the main trading logic of the international crude oil market has not changed. The positive factors come from the continuation of U.S. sanctions policies on oil-producing countries and geopolitical uncertainties, while the negative factors are... OPEC+ maintains its stance on increasing production amidst a sluggish global economy. The International Energy Agency is set to release its latest monthly report today, which may show an improved outlook for oil demand. It is expected that international oil prices will rise tomorrow.
8. Data Calendar
Table 3 Domestic Polyethylene Data Overview Table (Unit: Ten Thousand Tons)
|
Data |
Publication Date |
Previous Data |
The trend for this period is expected |
|
PE Production Enterprise Total Inventory (10,000 tons) |
Wednesday 17:00PM |
45.83 |
↘ |
|
PE Social Sample Warehouse Inventory |
Tuesday 17:00PM |
-2.16% |
↘ |
|
PE Weekly Production (10,000 tons) |
Thursday 17:00PM |
64.26 |
↗ |
|
PE maintenance impact volume (10,000 tons) |
Thursday 17:00PM |
11.37 |
↘ |
|
Weekly Capacity Utilization Rate of PE |
Thursday 17:00PM |
81.84% |
↗ |
|
PE downstream industry capacity utilization rate |
Thursday 17:00PM |
1.21% |
↗ |
|
PE Mindset Survey |
Thursday 12:00AM |
-13.36% |
↗ |
|
Data Source: Longzhong Information Remarks: 1. Consider significant fluctuations as those where the change exceeds 3%, highlighting the data dimensions with such increases or decreases. 2. ↗↘ is considered a narrow fluctuation, highlighting data with a price change of 0-3%. The above data is updated every Thursday. |
|||
【Copyright and Disclaimer】The above information is collected and organized by PlastMatch. The copyright belongs to the original author. This article is reprinted for the purpose of providing more information, and it does not imply that PlastMatch endorses the views expressed in the article or guarantees its accuracy. If there are any errors in the source attribution or if your legitimate rights have been infringed, please contact us, and we will promptly correct or remove the content. If other media, websites, or individuals use the aforementioned content, they must clearly indicate the original source and origin of the work and assume legal responsibility on their own.
Most Popular
-

AI Computing Power Demand Ignites Electronic Fabrics! China Jushi Hits Limit Up! Domestic Substitution Welcomes Golden Window
-

Focus on going global! kingfa sci. leads, huitong, preter, and kumho nire follow, china’s modified plastics frenziedly expanding worldwide
-

Back-to-back major joker moves! covestro’s 1.32 million ton mdi dual-line expansion and hdi acquisition reshape global polyurethane landscape
-

Evonik Parts Ways With The Polyester Business! A Strategic Retreat By A Germany Chemical Giant And The Global Industry Shift
-

PA66 Cost and Profit: Broad-Based Weakness in the Feedstock Market Continues to Erode Cost Support for PA66 (202606)


