


[PC Daily Review] Market Shows Weak Fluctuations and Adjustments
1 Today's Summary
Monday International Crude Oil Rise , ICE Brent crude futures for December contract at 63.32, up by 0.59 USD/barrel.
②、 The closing price of raw material Bisphenol A in the East China market is 7650. Yuan/ton, a decrease of 50 yuan/ton compared to the previous period.
③. This week's latest ex-factory prices for domestic PC factories are stable or have increased by 100-200 RMB/ton.
2 Spot Overview
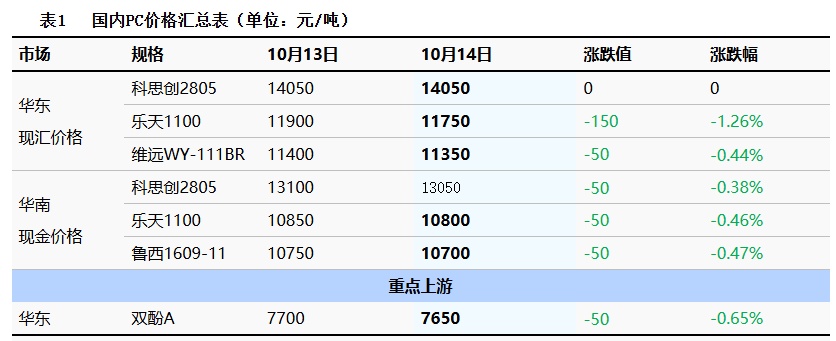
The domestic PC market experienced narrow-range consolidation today. By the afternoon closing, the mainstream negotiation range for East China injection molding low-end materials was 10,400-13,400 yuan/ton, and for mid-to-high-end materials, it was 14,050-14,800 yuan/ton, with the overall focus remaining roughly stable compared to last Saturday. At the beginning of the week, there were few updates on the latest ex-factory guidance from domestic PC factories, except for a factory in Southwest China which raised its latest ex-factory price by 200 yuan/ton. In the spot market, both East China and South China remained stable and consolidated. There are no new favorable factors boosting the fundamentals, and after some downstream phase purchases, the focus has shifted to observing and digesting inventory. Stakeholders have become more cautious, engaging in flexible negotiations while following market trends, with some reports of low-priced profit-taking transactions being heard.
|
Figure 1: Price Trend Chart of East China PC Market (Unit: Yuan/Ton) |
Figure 2 Domestic PC Price Trends in Various Regions (Unit: yuan/ton) |
|
|
|
|
Data source: Longzhong Information |
Data Source: Longzhong Information |
")
")
3 Production Dynamics
Today, the capacity utilization rate of domestic PC factories is 80.92%; the price of bisphenol A in the East China market has dropped by 50 yuan/ton to 7,650 yuan/ton, and the gross profit margin of the domestic PC industry has decreased by 5 yuan/ton compared to the previous working day, standing at -35 yuan/ton.
|
Figure 3: Domestic PC Weekly Capacity Utilization Rate Trend Chart |
Figure 4 Domestic PC Profit and Price Comparison Chart (Unit: Yuan/Ton) |
|
|
") |
|
Data source: Longzhong Information |
Data source: Longzhong Information |
")
4 Price Prediction
The current domestic PC market shows a clear differentiation in response. The efforts by factories to maintain prices have provided insufficient support to the spot market, and as profit-taking follows the market movements, the market focus is trending downward. In the short term, the main PC factories' equipment maintenance and the expectation of continued low overall supply in the fourth quarter still support PC prices. However, considering the slow pace of spot consumption and the generally weak impact of related products, it is expected that the domestic PC market will mainly operate in a narrow range with weak consolidation.
5. Related Product Information
BPA Market: Taking East China as the benchmark, the price of BPA in East China today is 7,650 yuan/ton, ranging from 7,600 to 7,700 yuan/ton, down 50 yuan/ton from the previous trading day, in line with morning expectations. Today, the market focus in East China has declined, with downstream buying interest not high, inquiries are sparse, and the mindset of holders is weak, leading to a high intention to sell. The focus of actual transactions continues to weaken, with very few new orders being concluded in the market.
6 Data Calendar
Table 2 Overview of Domestic PC Data (Unit: Yuan/Ton)
|
Data |
Publication Date |
Previous Data |
This period's trend forecast. |
|
Capacity utilization rate |
Thursday 4:30 PM |
80.92% |
↘ |
|
PC average weekly profit |
Thursday 16:00 PM |
-220 |
↗ |
|
Data source: Longzhong Information Remarks: 1. Consider ↓↑ as significant fluctuations, highlighting data dimensions with price changes exceeding 3%. 2. Treat ↗↘ as narrow fluctuations, highlighting data where the price change is within 0-3%. |
|||
【Copyright and Disclaimer】The above information is collected and organized by PlastMatch. The copyright belongs to the original author. This article is reprinted for the purpose of providing more information, and it does not imply that PlastMatch endorses the views expressed in the article or guarantees its accuracy. If there are any errors in the source attribution or if your legitimate rights have been infringed, please contact us, and we will promptly correct or remove the content. If other media, websites, or individuals use the aforementioned content, they must clearly indicate the original source and origin of the work and assume legal responsibility on their own.
Most Popular
-

AI Computing Power Demand Ignites Electronic Fabrics! China Jushi Hits Limit Up! Domestic Substitution Welcomes Golden Window
-

Focus on going global! kingfa sci. leads, huitong, preter, and kumho nire follow, china’s modified plastics frenziedly expanding worldwide
-

Back-to-back major joker moves! covestro’s 1.32 million ton mdi dual-line expansion and hdi acquisition reshape global polyurethane landscape
-

Evonik Parts Ways With The Polyester Business! A Strategic Retreat By A Germany Chemical Giant And The Global Industry Shift
-

PA66 Cost and Profit: Broad-Based Weakness in the Feedstock Market Continues to Erode Cost Support for PA66 (202606)


