


[pbt daily review] raw material support is average, pbt market remains cautiously observant
1 Today's Summary
① This week's PBT manufacturers' quotations remained stable overall.
② There are fewer PBT unit maintenances this week.
③ The PBT production for this period is 22,600 tons. Capacity utilization rate is 53.14%, remaining stable compared to the previous period. 。 The average domestic PBT gross profit this week is at-343 yuan/ton, a month-on-month decrease of 19 yuan/ton 。
2 Spot Overview
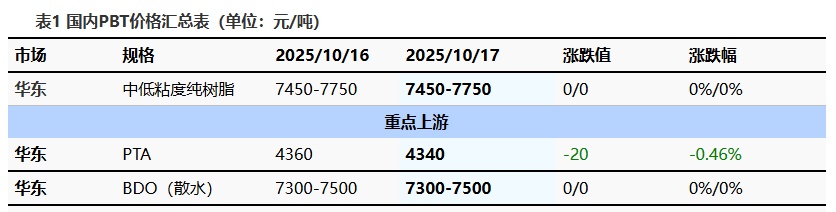
The mainstream price of medium-low viscosity PBT resin in the East China region is 7,450-7,750 yuan/ton today, unchanged from the previous working day. Today, the PBT market is operating with a wait-and-see attitude, the PTA market continues to be weak, and the BDO market is undergoing narrow fluctuations. The support from the raw material side is average. Approaching the weekend, the PBT market news is relatively quiet, with negotiation focus fluctuating within a range. , According to Longzhong Information statistics, the price of low viscosity PBT pure resin in the East China market is 7,450-7,750 yuan/ton.
3 Production Dynamics
There are not many changes in the PBT device within the week. The PBT unit at Meizhou Bay, Fujian (Fujian Haiquan) continues to undergo maintenance. The domestic PBT supply remains stable. The PBT production for this period is 22,600 tons. Capacity utilization rate is 53.14%, remaining stable compared to the previous period. 。 The average domestic PBT gross profit this week is in-343 yuan/ton, a decrease of 19 yuan/ton compared to the previous period 。
|
Figure 2: Trend Chart of Domestic PBT Capacity Utilization Rate in 2025 |
Figure 3 2025 Domestic PBT Profit and Price Comparison Chart (Yuan/Ton) |
")
|
")
|
|
Data Source: Longzhong Information |
Data Source: Longzhong Information |
4 Price Prediction
The PBT market is expected to continue to operate weakly. On the raw material side, the main PTA producers have reduced operations due to certain reasons, leading to a slight decrease in supply, and the inventory reduction in the balance sheet has expanded. However, due to many external instabilities, the overall trend of commodities is sluggish, with a strong sense of pessimism in the industry chain. In the short term, the PTA spot market will maintain a volatile pattern. As the BDO settlement period approaches, market participants are mainly observing, with few spot negotiations as contract orders are fulfilled. Costs are unlikely to provide effective support, and the sentiment within the PBT market is generally negative. In a buyer's market, the market focus still faces the risk of decline. Therefore, Longzhong expects the East China market's medium and low viscosity PBT resin to be priced at 7,450-7,750 yuan/ton tomorrow.
5 Related Product Information
PTA Market: The current PTA spot price is down 20 to 4,340. The October main port delivery 01 offers a discount of 80-85, warehouse receipt discount is around 50, and bids are heard at a discount of 80-85 for transactions. The November main port delivery 01 bids are transacted at a discount of around 65. Throughout the day, the absolute price fluctuated and trended downward, continuing the weak macro and weak cost trends. Spot liquidity slightly narrowed, spot basis improved slightly, and overall trading was average. (Unit: yuan/ton)
BDO Market: As of the time of writing, the mainstream discussion for bulk cargo in the East China region is at 7,300-7,500 yuan/ton, and for drum packaging, it is at 8,300-8,500 yuan/ton (delivered with acceptance), which is stable compared to the previous period. Today, the BDO market in the East China region is operating with a wait-and-see attitude. Current supply-side support still exists, and suppliers are continuing to stabilize the market. Approaching the settlement period, downstream buyers are entering the market with a wait-and-see approach and following up on just-in-need purchases, while the market is weakly stable.
6 Data Calendar
Table 2 Domestic PBT Data Overview (Unit: ton, yuan/ton)
|
Data |
Publication Date |
Previous Data |
Current Trend Forecast |
|
PBT Capacity utilization rate |
Thursday 5:00 PM |
53.14 % |
↗ |
|
PBT Weekly Production |
Thursday 5:00 PM |
2.26 Ten thousand tons |
↗ |
|
PBT Weekly Profit |
Thursday 5:00 PM |
-343 yuan/ton |
↘ |
|
Data Source: Longzhong Information Remarks: 1 Consider significant fluctuations as those with changes of more than 3%, highlighting the data dimensions with such increases or decreases. 2 Considered narrow fluctuations, highlighting data with changes within 0-3%. |
|||
【Copyright and Disclaimer】The above information is collected and organized by PlastMatch. The copyright belongs to the original author. This article is reprinted for the purpose of providing more information, and it does not imply that PlastMatch endorses the views expressed in the article or guarantees its accuracy. If there are any errors in the source attribution or if your legitimate rights have been infringed, please contact us, and we will promptly correct or remove the content. If other media, websites, or individuals use the aforementioned content, they must clearly indicate the original source and origin of the work and assume legal responsibility on their own.
Most Popular
-

AI Computing Power Demand Ignites Electronic Fabrics! China Jushi Hits Limit Up! Domestic Substitution Welcomes Golden Window
-

Focus on going global! kingfa sci. leads, huitong, preter, and kumho nire follow, china’s modified plastics frenziedly expanding worldwide
-

Back-to-back major joker moves! covestro’s 1.32 million ton mdi dual-line expansion and hdi acquisition reshape global polyurethane landscape
-

Evonik Parts Ways With The Polyester Business! A Strategic Retreat By A Germany Chemical Giant And The Global Industry Shift
-

PA66 Cost and Profit: Broad-Based Weakness in the Feedstock Market Continues to Erode Cost Support for PA66 (202606)


