


[PBT Daily Review] Raw Material Prices Continue to Fall, PBT Market Remains Weak
1 Today's Summary
PBT manufacturers' quotations remain stable.
This week, there are fewer PBT unit maintenance activities.
③ The PBT production for this period was 22,600 tons, a decrease of 500 tons from the previous period, a decline of 2.16%. The capacity utilization rate was 53.14%, down 1.32% from the previous period. This week, the average domestic gross profit of PBT was -548 yuan/ton, down 44 yuan/ton from the previous week. 。
2 Current Spot Overview
Table 1 Domestic PBT Price Summary (Unit: Yuan/Ton)
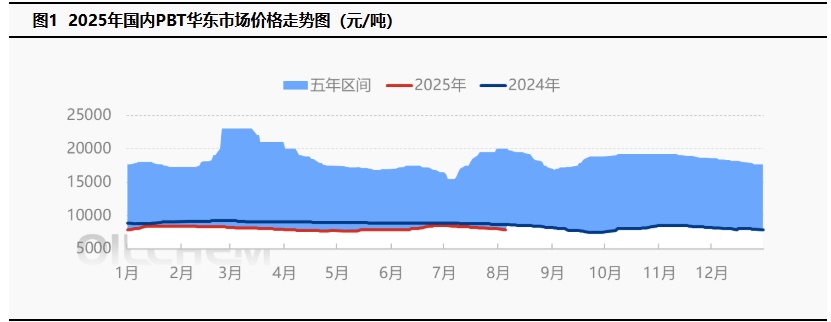
The mainstream price of medium and low viscosity PBT resin in the East China region is between 7750-8200 yuan/ton today, stable compared to the previous working day. Today, the PBT market was weak and cautious, the PTA market rebounded slightly, and the BDO market fell sharply. With raw material prices continuing to decline, most players in the PBT market hold a pessimistic outlook for the future. The market remains weak, with reports of low prices. According to Longzhong Information, the price of low-viscosity PBT pure resin in the East China market is 7,750-8,200 yuan/ton.
3 Production Dynamics
The PBT production for this period is 22,600 tons, a decrease of 500 tons compared to the previous period, representing a decline of 2.16%. The capacity utilization rate is 53.14%, down by 1.32% from the previous period. During the week, Nantong Xingchen PBT unit underwent maintenance, and Changhong Bio PBT unit reduced its load, leading to a decrease in domestic PBT supply. 。 The average gross profit of domestic PBT this week was -548 yuan/ton, down 44 yuan/ton week-on-week. 。
|
Figure 2 Trend of Domestic PBT Capacity Utilization Rate in 2025 |
Figure 3: 2025 Domestic PBT Profit and Price Comparison Chart (Yuan/Ton) |
![[PBT日评]:成本面支撑不足 PBT市场偏弱观望(20250730)](https://oss.plastmatch.com/zx/image/15c5fa031bd04d80861a7831f26d35f1.png "[PBT日评]:成本面支撑不足 PBT市场偏弱观望(20250730)")
|
![[PBT日评]:成本面支撑不足 PBT市场偏弱观望(20250730)](https://oss.plastmatch.com/zx/image/501ba20ee7b24a948c7eb01a7ba87bb1.png "[PBT日评]:成本面支撑不足 PBT市场偏弱观望(20250730)")
|
|
Data source: Longzhong Information |
Data source: Longzhong Information |
4 Price Prediction
The PBT market is expected to experience weak fluctuations. In terms of raw materials, the demand side for PTA is performing poorly due to the traditional off-season, and some companies are reducing production due to low processing fees and efficiency issues. As the overall sentiment in commodities is warming up, there is a supply tightness in raw materials, and cost support is rising again. In the short term, the PTA spot market is expected to continue rebounding. There are no favorable factors released in the BDO market on the supply and demand side, with major players having a bearish purchasing and selling mindset. Negotiations are predominantly about price concessions, and the market is in a weak fluctuation. The decline in raw materials is continuing, which may increase the possibility of a downward adjustment in the PBT market. Market participants have a bearish sentiment. Therefore, Longzhong expects that tomorrow, the price of low to medium viscosity PBT resin in the East China market will be around 7,700-8,200 yuan/ton.
5 , related product information
PTA Market: Today's PTA spot price increased by 15 to 4675. For August main port delivery, the September contract is trading at a discount of 15-20. For September main port delivery, the September contract is trading at a premium of 5-0. Commodity sentiment is recovering, with increased production benefits under low processing fees leading to reduced production. The absolute price was weak during the day but rebounded later. The spot basis remains weak, and market negotiations are average. (Unit: Yuan/ton)
BDO Market: As of the time of publication, the mainstream spot bulk negotiations in East China are between 7800-8000 yuan/ton, and barrel negotiations are between 8900-9000 yuan/ton (delivered with acceptance), down 100 yuan/ton from yesterday. Today, the BDO market in East China is experiencing a wide decline. The supply-demand contradiction continues, and sellers are strongly inclined to sell off due to panic. There are promotions and discounts available for actual transactions, and the market is weakly trending downward. Attention is needed on the execution of low-price transactions.
6 Data Calendar
Table 2 Overview of Domestic PBT Data (Unit: Tons, Yuan/Ton)
|
Data |
Publication Date |
Previous Data |
The trend for this period is expected |
|
PBT Capacity utilization rate |
Thursday 5:00 PM |
53.14 % |
↘ |
|
PBT Weekly Production |
Thursday 5:00 PM |
2.26 10,000 tons |
↘ |
|
PBT Weekly Profit |
Thursday, 5:00 PM |
-548 yuan/ton |
↘ |
|
Data Source: Longzhong Information Remarks: 1 Consider a significant fluctuation as an increase or decrease of more than 3% and highlight such data dimensions. 2 Considered a narrow fluctuation, highlighting data with a change range within 0-3%. |
|||
【Copyright and Disclaimer】The above information is collected and organized by PlastMatch. The copyright belongs to the original author. This article is reprinted for the purpose of providing more information, and it does not imply that PlastMatch endorses the views expressed in the article or guarantees its accuracy. If there are any errors in the source attribution or if your legitimate rights have been infringed, please contact us, and we will promptly correct or remove the content. If other media, websites, or individuals use the aforementioned content, they must clearly indicate the original source and origin of the work and assume legal responsibility on their own.
Most Popular
-

AI Computing Power Demand Ignites Electronic Fabrics! China Jushi Hits Limit Up! Domestic Substitution Welcomes Golden Window
-

Focus on going global! kingfa sci. leads, huitong, preter, and kumho nire follow, china’s modified plastics frenziedly expanding worldwide
-

Back-to-back major joker moves! covestro’s 1.32 million ton mdi dual-line expansion and hdi acquisition reshape global polyurethane landscape
-

Evonik Parts Ways With The Polyester Business! A Strategic Retreat By A Germany Chemical Giant And The Global Industry Shift
-

PA66 Cost and Profit: Broad-Based Weakness in the Feedstock Market Continues to Erode Cost Support for PA66 (202606)


