


[PBT Daily Review] Market News Confused, PBT Market Fluctuates Narrowly
1 Today's Summary
①This week, PBT manufacturers have lowered their prices.
There were fewer PBT unit maintenance activities this week.
③ In this period, the PBT production was 22,200 tons, an increase of 900 tons from the previous period, with a growth rate of 4.23%. The capacity utilization rate was 52.30%, an increase of 2.12% from the previous period. 。 The average domestic PBT gross profit this week is -441 yuan/ton, a decrease of 4 yuan/ton compared to the previous week. 。
2 Spot Market Overview
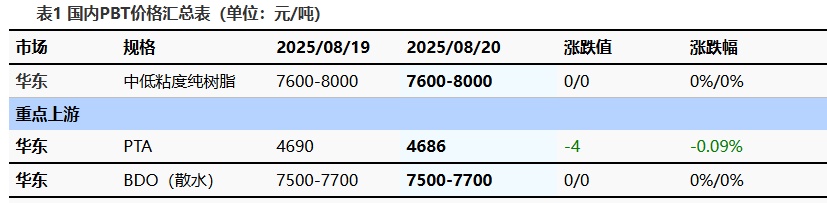
Based on the East China region, today's mainstream price for low to medium viscosity PBT resin is between 7,600 and 8,000 yuan per ton, remaining stable compared to the previous working day. Today, the PBT market is chaotic and stalemated. The PTA market is showing a strong consolidation, while the BDO market is running weakly. Raw material support remains temporarily stable. Information in the PBT market is rather confusing, leading to uncertain sentiment among industry players. Occasional low prices have been heard, but mainstream quotations remain within a certain range. According to Longzhong Information, the price of medium- and low-viscosity pure PBT resin in the East China market is 7,600-8,000 yuan/ton.
3 Production Dynamics
The maintenance of Nantong Xingchen's PBT plant was completed during the week, resulting in an increase in domestic PBT supply. This period's PBT output was 22,200 tons, an increase of 900 tons compared to the previous period, up by 4.23%. The capacity utilization rate was 52.30%, up by 2.12% from the previous period. 。 This week, the average gross profit of domestic PBT is -441 yuan/ton, down 4 yuan/ton from the previous week. 。
|
Figure 2 Domestic PBT Capacity Utilization Rate Trend in 2025 |
Figure 3 Year 2025 Domestic PBT Profit and Price Comparison Chart (Yuan/Ton) |
![[PBT日评]:原料延续走跌 PBT市场观望运行(20250814)](https://oss.plastmatch.com/zx/image/365f66169cc84d098ff1dcb0b9f0fb9e.png "[PBT日评]:原料延续走跌 PBT市场观望运行(20250814)")
|
![[PBT日评]:原料延续走跌 PBT市场观望运行(20250814)](https://oss.plastmatch.com/zx/image/ce1cfaff002a45ff99c7aa24285153bc.png "[PBT日评]:原料延续走跌 PBT市场观望运行(20250814)")
|
|
Data source: Longzhong Information |
Data source: Longzhong Information |
4 Price Prediction
The PBT market is expected to remain stable. The supply and demand for raw material PTA maintain a tight pattern, with macro sentiments driving an overall strong trend in commodities. With low valuations, cost support remains solid, and there is an expectation of a continued rebound in the short-term PTA spot market. The BDO market is in a period of transition between old and new cycles, with market participants maintaining a wait-and-see attitude, awaiting new monthly policy guidance. Although there are downstream inquiries, actual transactions are currently limited. Changes in raw materials and fundamentals are temporarily limited, and the PBT market remains cautious, with the supply and demand standoff persisting. The market is expected to fluctuate within a range. Therefore, Longzhong predicts that tomorrow, the price for medium to low viscosity PBT resin in the East China market will be between 7,600-8,000 yuan/ton.
5 Relevant Product Information
PTA Market: Today's PTA spot price decreased by 4 to 4686. August main port delivery for September traded at a discount of 0-5, with slightly lower warehouse receipts, while September main port delivery for September traded at a premium of 10-18. Macro expectations drove improved sentiment, with absolute prices weakening and consolidating with costs intraday before rebounding. The spot and forward basis continued to improve, buying sentiment was acceptable, and market negotiations were average. (Unit: RMB/ton)
BDO Market: As of the time of writing, the mainstream spot bulk negotiations in the East China region are at 7500-7700 yuan/ton, with packaged negotiations at 8500-8700 yuan/ton (delivered on acceptance), remaining unchanged from yesterday. Today, the BDO market in East China fluctuated within a range. At the end of the trading cycle, industry participants are observing with a strong sense of caution. Downstream just-in-demand purchasing continues, with holders' quotations stable, and the market remains weakly stagnant, awaiting new cycle policy guidance.
6 Data Calendar
Table 2 Overview of Domestic PBT Data (Unit: ton, RMB/ton)
|
Data |
Release Date |
Previous period data |
This period's trend forecast |
|
PBT Capacity utilization rate |
Thursday 5:00 PM |
52.30 % |
↗ |
|
PBT Weekly Output |
Thursday 5:00 PM |
2.22 10,000 tons |
↗ |
|
PBT Weekly Profit |
Thursday 5:00 PM |
-441 yuan/ton |
↘ |
|
Data source: Longzhong Information Remarks: 1 Treat "↓↑" as significant fluctuations, highlighting data dimensions with a price change exceeding 3%. 2 Regarded as narrow fluctuations, highlighting data with price changes within the range of 0-3%. |
|||
【Copyright and Disclaimer】The above information is collected and organized by PlastMatch. The copyright belongs to the original author. This article is reprinted for the purpose of providing more information, and it does not imply that PlastMatch endorses the views expressed in the article or guarantees its accuracy. If there are any errors in the source attribution or if your legitimate rights have been infringed, please contact us, and we will promptly correct or remove the content. If other media, websites, or individuals use the aforementioned content, they must clearly indicate the original source and origin of the work and assume legal responsibility on their own.
Most Popular
-

AI Computing Power Demand Ignites Electronic Fabrics! China Jushi Hits Limit Up! Domestic Substitution Welcomes Golden Window
-

Focus on going global! kingfa sci. leads, huitong, preter, and kumho nire follow, china’s modified plastics frenziedly expanding worldwide
-

Back-to-back major joker moves! covestro’s 1.32 million ton mdi dual-line expansion and hdi acquisition reshape global polyurethane landscape
-

Evonik Parts Ways With The Polyester Business! A Strategic Retreat By A Germany Chemical Giant And The Global Industry Shift
-

PA66 Cost and Profit: Broad-Based Weakness in the Feedstock Market Continues to Erode Cost Support for PA66 (202606)


