


[pbt daily review] little change in raw materials, pbt market remains stable
1 Today's Summary
① The PBT manufacturer's quotation remained stable overall this week.
This week, there are fewer PBT unit maintenance activities.
③ The PBT production for this period is 23,800 tons, with a capacity utilization rate of 56.11%. Compared to the previous period, it remains unchanged. 。 This week's average domestic PBT gross profit is -307 yuan/ton, an increase of 72 yuan/ton compared to the previous week. 。
2 Spot Overview
Table 1 Domestic PBT Price Summary (Unit: Yuan/Ton)
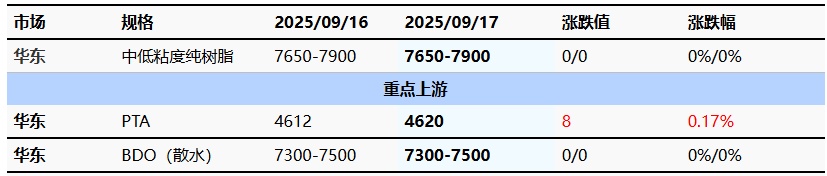
In the East China region, the mainstream price of medium-to-low viscosity PBT resin is between 7,650-7,900 yuan/ton today, stable compared to the previous working day. Today's PBT market offers are temporarily stable, the PTA market is fluctuating within a narrow range, and the BDO market is experiencing range fluctuations. There is little change on the raw material side, and PBT...The market center fluctuates within a narrow range. , Downstream and end-user demand follow-up , According to Longzhong Information, the price of low-viscosity PBT pure resin in the East China market is 7,650-7,900 yuan/ton.
3 Production dynamics
Within the week Maintain stable production of the PBT unit. The domestic PBT supply remains stable. The PBT production for this period is 23,800 tons, with a capacity utilization rate of 56.11%. Compared to the previous period, it remained unchanged. 。 The average domestic PBT gross profit this week is -307 yuan/ton, an increase of 72 yuan/ton compared to the previous week. 。
|
Figure 2: Trend Chart of Domestic PBT Capacity Utilization Rate in 2025 |
Figure 3 2025 Domestic PBT Profit and Price Comparison Chart (CNY/ton) |
")
|
")
|
|
Data Source: Longzhong Information |
Data Source: Longzhong Information |
4 Price prediction
The PBT market is expected to continue its wait-and-see operation. On the raw material side, the traditional peak season for PTA terminals has performed below expectations, and there is a strong expectation of weakening supply and demand, with a forecasted inventory accumulation in the balance sheet. The overall trend of commodities is warming up, processing fees are at a low level, and the market lacks continuous driving forces. In the short term, PTA spot prices are expected to continue fluctuating; there are no significant changes in the supply and demand of BDO, and operators are maintaining a stable wait-and-see approach, with trading based on just-in-time orders. Holders are mostly quoting according to the market, and market fluctuations are difficult. As the settlement period approaches, the wait-and-see sentiment in the market continues. Slight fluctuations in costs continue to support the PBT market, and market participants maintain a relatively stable mindset. The market focus is expected to continue with narrow adjustments, and the short-term PBT market may remain stable. Therefore, Longzhong expects the East China market price for low and medium viscosity PBT resin to be between 7,650-7,900 yuan/ton tomorrow.
5 "Related Product Information"
PTA Market: The current PTA spot price increased by 8 to 4,620. The September main port delivery offer is 01 discount of 70-75, and the bid is 01 discount of 75-80 with transactions. The October main port delivery offer is 01 discount of 50-55, and transactions occurred around a 60 discount. Cost and supply-demand are driving in opposite directions, with continuous tussle between long and short positions. The absolute price fluctuated repeatedly within the day and ultimately closed higher, with the spot basis showing narrow fluctuations and overall average trading. (Unit: RMB/ton)
BDO Market: As of the time of writing, the mainstream spot bulk negotiations in the East China region are 7,300-7,500 RMB/ton, and barrel negotiations are 8,300-8,500 RMB/ton (delivered with acceptance). Month-on-month unchanged Today in the East China regionBDO MarketThe observation is ongoing. There are expectations of policy tightening in October, but The news is mixed, and industry players are mainly adopting a wait-and-see attitude. Downstream follows up as needed or digests inventory, while holders remain stable and watchful, with no fluctuations in the market focus. 。
6 Data Calendar
Table 2: Overview of Domestic PBT Data (Unit: Ton, Yuan/Ton)
|
Data |
Publication date |
Previous Data |
This issue's trend forecast |
|
PBT Capacity utilization rate |
Thursday 5:00 PM |
56.11 % |
- |
|
PBT Weekly Production |
Thursday 5:00 PM |
2.38 10,000 tons |
- |
|
PBT Weekly Profit |
Thursday 5:00 PM |
-307 yuan/ton |
↘ |
|
Data source: Longzhong Information Note: 1 Consider significant fluctuations as those with changes exceeding 3%, highlighting the data dimensions with such increases or decreases. 2 Considered as narrow fluctuations, highlighting data with a rise or fall range within 0-3%. |
|||
【Copyright and Disclaimer】The above information is collected and organized by PlastMatch. The copyright belongs to the original author. This article is reprinted for the purpose of providing more information, and it does not imply that PlastMatch endorses the views expressed in the article or guarantees its accuracy. If there are any errors in the source attribution or if your legitimate rights have been infringed, please contact us, and we will promptly correct or remove the content. If other media, websites, or individuals use the aforementioned content, they must clearly indicate the original source and origin of the work and assume legal responsibility on their own.
Most Popular
-

AI Computing Power Demand Ignites Electronic Fabrics! China Jushi Hits Limit Up! Domestic Substitution Welcomes Golden Window
-

Focus on going global! kingfa sci. leads, huitong, preter, and kumho nire follow, china’s modified plastics frenziedly expanding worldwide
-

Back-to-back major joker moves! covestro’s 1.32 million ton mdi dual-line expansion and hdi acquisition reshape global polyurethane landscape
-

Evonik Parts Ways With The Polyester Business! A Strategic Retreat By A Germany Chemical Giant And The Global Industry Shift
-

PA66 Cost and Profit: Broad-Based Weakness in the Feedstock Market Continues to Erode Cost Support for PA66 (202606)


