


[PBT Daily Review] Little Change in Fundamentals, PBT Market Remains Stable
1 Today's Summary
This week, PBT manufacturers' quotations remained generally stable.
This week, there are fewer maintenance activities for the PBT equipment.
③ The PBT production in this period is 23,800 tons, with a capacity utilization rate of 56.11%. Remains the same as the previous period. 。 The average domestic PBT gross profit this week is -307 yuan/ton, an increase of 72 yuan/ton compared to the previous week. 。
2 Spot Overview
Table 1 Domestic PBT Price Summary (Unit: Yuan/Ton)
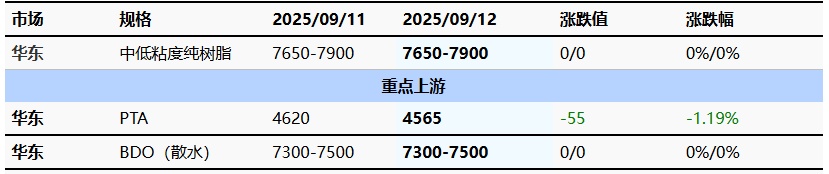
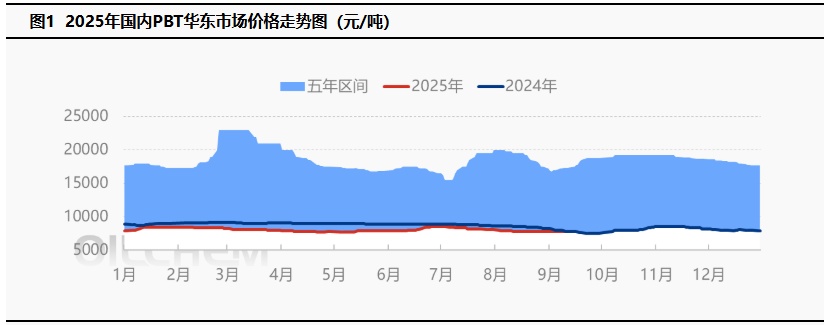
The mainstream price of medium and low viscosity PBT resin in the East China region is between 7,650-7,900 yuan/ton today, remaining stable compared to the previous working day. Today, the PBT market is running steadily with limited fluctuations, the PTA market is experiencing a downward shift, and the BDO market is undergoing narrow-range adjustments. The raw material side is slightly volatile, affecting PBT.MarketThe impact is limited, and as the weekend approaches, the market continues to adopt a wait-and-see attitude. According to Longzhong Information, the price of low-viscosity PBT pure resin in the East China market ranges from 7,650 to 7,900 yuan per ton.
3 Production Dynamics
Within the week The PBT equipment maintains stable production. Domestic PBT supply remains stable. The production of PBT in this period is 23,800 tons, with a capacity utilization rate of 56.11%. Compared to the previous period, it remains unchanged. 。 The average domestic PBT gross profit this week is -307 yuan/ton, up 72 yuan/ton from the previous week. 。
|
Figure 2 Trend of Domestic PBT Capacity Utilization Rate in 2025 |
Figure 3 Year 2025 Domestic PBT Profit and Price Comparison Chart (Yuan/Ton) |
")
|
")
|
|
Data Source: Longzhong Information |
Data Source: Longzhong Information |
4 Price Prediction
The PBT market is expected to continue its stalemate. On the raw material front, the low processing fee of PTA may affect the pace of enterprise restarts and new installations. However, the overall commodity trend remains weak, with raw material performance sluggish and costs gradually retreating, leading to a continued weak pattern in the short-term PTA spot market. There are no significant fluctuations in the supply and demand of BDO, and as the settlement period approaches, the market sentiment remains watchful. The supply-side support remains weak, and downstream demand follows just-in-time needs, resulting in ongoing negotiation standoffs. The demand for PBT is expected to increase slowly, but the support for the market is limited, with the market focus predicted to fluctuate within a range. In the short term, the PBT market may continue its consolidation pattern. Therefore, Longzhong anticipates that the East China market price for low to medium viscosity PBT resin is expected to be between 7,650-7,900 yuan/ton tomorrow.
5 Related Product Information
PTA Market: Today’s PTA spot price is -55 to 4565 yuan/ton. September main port delivery offers are at a discount of 70-75 to the 01 contract, with bids at a discount of 75-80 to the 01 contract and some deals concluded. October main port delivery offers are around a discount of 50 to the 01 contract, with no deals reported. The absolute price showed continued weakness during the day. The weak cost side constrained market sentiment. Spot liquidity tends to be ample, and the spot basis continues to loosen. Overall trading activity was average. (Unit: yuan/ton)
BDO Market: As of the time of writing, the mainstream negotiation price for spot bulk water in East China is 7,300-7,500 yuan/ton, and for packaged water is 8,300-8,500 yuan/ton (delivered on acceptance), remaining flat compared to the previous period. Today, the BDO market in East China is undergoing a narrow range of adjustments. As the weekend approaches, market participants continue to adopt a wait-and-see attitude, mostly waiting for the October policy cycle. The negotiation between supply and demand is in a stalemate, and the market is operating in a deadlock.
6 Data Calendar
Table 2 Domestic PBT Data Overview (Unit: tons, yuan/ton)
|
Data |
Release Date |
Previous period data |
This period's trend is expected |
|
PBT Capacity utilization rate |
Thursday 5:00 PM |
56.11 % |
- |
|
PBT Weekly output |
Thursday 5:00 PM |
2.38 Ten thousand tons |
- |
|
PBT Weekly Profit |
Thursday 5:00 PM |
-307 yuan/ton |
↘ |
|
Data source: Longzhong Information Note: 1 Consider significant fluctuations as those exceeding 3% in the rise and fall dimensions. 2 ↗↘ are regarded as narrow fluctuations, highlighting data with price changes within 0-3%. |
|||
【Copyright and Disclaimer】The above information is collected and organized by PlastMatch. The copyright belongs to the original author. This article is reprinted for the purpose of providing more information, and it does not imply that PlastMatch endorses the views expressed in the article or guarantees its accuracy. If there are any errors in the source attribution or if your legitimate rights have been infringed, please contact us, and we will promptly correct or remove the content. If other media, websites, or individuals use the aforementioned content, they must clearly indicate the original source and origin of the work and assume legal responsibility on their own.
Most Popular
-

AI Computing Power Demand Ignites Electronic Fabrics! China Jushi Hits Limit Up! Domestic Substitution Welcomes Golden Window
-

Focus on going global! kingfa sci. leads, huitong, preter, and kumho nire follow, china’s modified plastics frenziedly expanding worldwide
-

PA66 Cost and Profit: Broad-Based Weakness in the Feedstock Market Continues to Erode Cost Support for PA66 (202606)
-

Back-to-back major joker moves! covestro’s 1.32 million ton mdi dual-line expansion and hdi acquisition reshape global polyurethane landscape
-

Evonik Parts Ways With The Polyester Business! A Strategic Retreat By A Germany Chemical Giant And The Global Industry Shift


