


[pbt daily review] increased selling mindset leads to weak fluctuations in pbt market
1 Today's Summary
This week's PBT manufacturers' quotations remained stable overall.
This week, there are fewer PBT unit maintenance activities.
③ The PBT production for this period is 22,600 tons. Capacity utilization rate is 53.14%, remaining stable compared to the previous period. 。 This week's average gross profit of domestic PBT is -324 yuan/ton, a decrease of 58 yuan/ton compared to the previous week. 。
2 Spot Overview
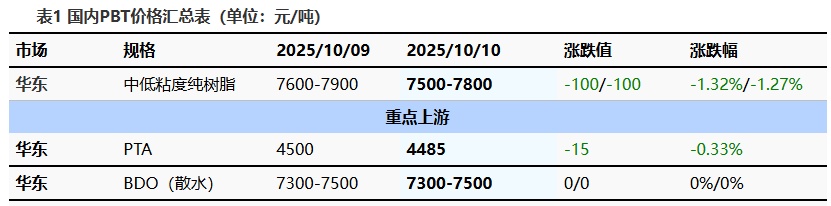
As a benchmark for the East China region, the mainstream price of medium and low viscosity PBT resin today is 7,500-7,800 yuan/ton, a decrease of 100 yuan/ton compared to the previous working day. Today, the PBT market experienced weak fluctuations, the PTA market continued to weaken, and the BDO market remained weak and stagnant. With average support from the raw materials side, the selling sentiment in the PBT market increased, leading to a weakening focus on actual negotiations. , According to Longzhong Information's statistics, the price of low-viscosity PBT pure resin in the East China market is 7,500-7,800 RMB/ton.
3 Production Dynamics
There is little change in the PBT equipment during the week. The PBT unit at Fujian Meizhou Bay (Fujian Haiquan) continues its maintenance. The domestic PBT supply remains stable. The PBT production for this period is 22,600 tons. Capacity utilization rate is 53.14%, remaining stable compared to the previous period. 。 The average gross profit of domestic PBT this week is -324 yuan/ton, a decrease of 58 yuan/ton from the previous week. 。
|
Figure 2: Trend Chart of Domestic PBT Capacity Utilization Rate in 2025 |
Figure 3 2025 Domestic PBT Profit and Price Comparison Chart (Yuan/Ton) |
")
|
")
|
|
Data Source: Longzhong Information |
Data Source: Longzhong Information |
4 Price Prediction
The PBT market is expected to operate weakly. On the raw material side, PTA supply and demand maintain a tight pattern, with the balance sheet continuously being destocked. However, there is a lack of external positive factors, and the decline in oil prices weakens cost support. Additionally, the downstream purchasing enthusiasm is hindered due to weak terminal sentiment, leading to a continued weak trend in the short-term PTA spot market. BDO supply-side support has slightly increased, with suppliers mainly aiming to stabilize the market, limiting trading space. Downstream follows up with just-needed contracts, spot purchasing is light and negotiated, making market fluctuations difficult. Raw material support is generally weak, making it difficult for the PBT market to receive favorable boosts. Therefore, Longzhong expects the East China market to see low-viscosity PBT resin at 7,500-7,800 yuan/ton tomorrow.
5 ==Related Product Information
PTA Market: Today's PTA spot price is down 15 to 4485. The October main port delivery for 01 is quoted at a discount of 60-65, with warehouse receipts at a discount of 50-55. Offers are at a discount of 65-75, with some transactions reportedly completed at a discount of 60-70. For November main port delivery for 01, transactions have been completed at around a discount of 55. Weak costs and weak expectations are restraining sentiment, with both absolute prices and spot basis being weak, leading to overall subdued trading. (Unit: RMB/ton)
BDO Market: As of the time of publication, the mainstream spot bulk negotiations in the East China region are at 7,300-7,500 RMB/ton, and barrel negotiations are at 8,300-8,500 RMB/ton (delivered with acceptance), remaining flat compared to the previous period. Today, the BDO market in East China fluctuated within a range. Supply-side support has slightly increased, with suppliers primarily maintaining market stability. Downstream buyers are following up as needed but are resistant to high prices, leading to a supply-demand negotiation standoff, resulting in a weak and stable market.
6 Data Calendar
Table 2 Overview of Domestic PBT Data (Unit: tons, yuan/ton)
|
Data |
Publication Date |
Previous Data |
The trend for this period is expected |
|
PBT Capacity utilization rate |
Thursday 5:00 PM |
53.14 % |
↗ |
|
PBT Weekly Production |
Thursday 5:00 PM |
2.26 Ten thousand tons |
↗ |
|
PBT Weekly Profit |
Thursday 5:00 PM |
-324 yuan/ton |
↘ |
|
Data Source: Longzhong Information Remarks: 1 Consider ↑↓ as significant fluctuations, highlighting data dimensions with price changes exceeding 3%. 2 Considered as narrow fluctuations, highlighting data with price changes within 0-3%. |
|||
【Copyright and Disclaimer】The above information is collected and organized by PlastMatch. The copyright belongs to the original author. This article is reprinted for the purpose of providing more information, and it does not imply that PlastMatch endorses the views expressed in the article or guarantees its accuracy. If there are any errors in the source attribution or if your legitimate rights have been infringed, please contact us, and we will promptly correct or remove the content. If other media, websites, or individuals use the aforementioned content, they must clearly indicate the original source and origin of the work and assume legal responsibility on their own.
Most Popular
-

AI Computing Power Demand Ignites Electronic Fabrics! China Jushi Hits Limit Up! Domestic Substitution Welcomes Golden Window
-

Focus on going global! kingfa sci. leads, huitong, preter, and kumho nire follow, china’s modified plastics frenziedly expanding worldwide
-

Back-to-back major joker moves! covestro’s 1.32 million ton mdi dual-line expansion and hdi acquisition reshape global polyurethane landscape
-

Evonik Parts Ways With The Polyester Business! A Strategic Retreat By A Germany Chemical Giant And The Global Industry Shift
-

PA66 Cost and Profit: Broad-Based Weakness in the Feedstock Market Continues to Erode Cost Support for PA66 (202606)


