


October Oil Price Roller Coaster: Trump "Turns Over a New Leaf," Supply and Demand Game Under Sino-U.S. Shadow War
In October, the international crude oil market did not continue the stable trend of the third quarter but instead fell into a chaotic pattern of "single-day surges and plunges, rapid shifts between bullish and bearish." From the panic-induced drop triggered by Trump's sudden outburst, to the rebound following the warming signals from the China-U.S. talks, and then to the decline after the reduced effect of sanctions on Russia, the monthly volatility of NYMEX crude oil soared to 18%. Each wave of fluctuation was deeply tied to geopolitical policies and major power games.
Infographic: How Trump Influences October Oil Prices
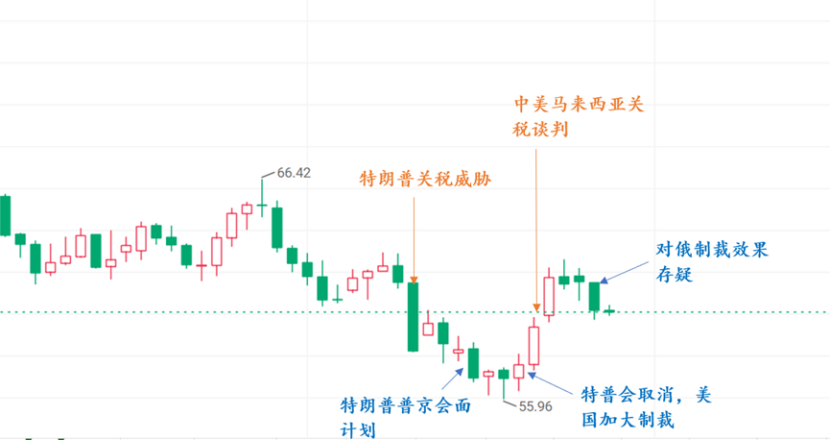
The oil price trends in October were driven by policy events, forming a cycle of "panic decline - bottoming expectations - policy rebound - fading benefits": On October 10, Trump's social media outburst combined with the U.S. government shutdown caused delays in non-farm payrolls and CPI data, leading to market concerns about demand, and WTI crude oil plummeted by 5.32% in a single day to $58.24 per barrel. In mid-October, the announcement of a planned meeting between Russian and American leaders led to market expectations of geopolitical easing, causing oil prices to bottom out again, with pessimism reaching its peak. Subsequently, the talks were suddenly canceled, and on October 22, the Trump administration intensified sanctions on Russia (covering 50% of Russian oil exports), reversing market expectations, and oil prices rose by a cumulative 8.47% over three days, with NYMEX crude oil reaching as high as $63. After the sanctions were implemented, Trump signaled that "tariffs are unsustainable," and on October 26, the U.S.-China Kuala Lumpur talks reached a consensus on postponing tariff suspensions, leading the market to expect an improvement in demand, causing oil prices to rise again. Ultimately, due to India's only slight reduction in Russian oil imports (from an average of 1.2 million barrels per day to 1.1 million barrels), and Yulong Petrochemical purchasing Russian crude oil for November shipment, the market realized that the impact of sanctions on Russia was less than expected, causing the previous risk premium to dissipate and oil prices to fall back.
From this perspective, the core logic of the market is a blend of excess background and "Trump-style" disruptions.
On one hand, the supply surplus is the core factor suppressing oil prices: OPEC+'s decision in October to increase production by 137,000 barrels per day in November, along with U.S. shale oil production nearing a peak of 13.7 million barrels per day; on the demand side, the IEA has lowered its forecast for growth in 2025 to 700,000 barrels per day, and the operating rates of refineries in China and the U.S. have dropped to 73.48% and 85.7%, respectively. Offshore crude oil inventories are approaching pandemic levels, and WTI futures have recently shown a "backwardation" for the first time in five months, highlighting the surplus.
On the other hand, Trump serves as a catalyst for short-term fluctuations rather than a trend setter. In October, his actions of "sharp decline - sanctions rebound - softening recovery" were all centered around U.S. interests—imposing sanctions on Russian oil to push India to buy U.S. oil (an annual increase of $3 billion in revenue), and easing tariffs to stabilize China's rare earth supply. Each round of actions hit market sentiment and amplified volatility.
Looking ahead, supply and demand pressures will influence the long-term trend of oil prices, but the short-term market rhythm will still be affected by geopolitical events. In the near future, the Sino-U.S. rivalry will become a key variable affecting oil prices. The consensus reached at the Kuala Lumpur talks on tariff suspensions, such as the U.S. side "no longer considering" the imposition of the planned 100% tariff on China set to take effect on November 1, is only a "temporary easing." Core differences regarding rare earth supply, energy trade, and other issues remain unresolved, and further details will depend on the meeting between the leaders of China and the U.S. at the APEC summit.
Author: Zhou Yongle, Senior Market Analysis Expert

【Copyright and Disclaimer】This article is the property of PlastMatch. For business cooperation, media interviews, article reprints, or suggestions, please call the PlastMatch customer service hotline at +86-18030158354 or via email at service@zhuansushijie.com. The information and data provided by PlastMatch are for reference only and do not constitute direct advice for client decision-making. Any decisions made by clients based on such information and data, and all resulting direct or indirect losses and legal consequences, shall be borne by the clients themselves and are unrelated to PlastMatch. Unauthorized reprinting is strictly prohibited.
Most Popular
-

AI Computing Power Demand Ignites Electronic Fabrics! China Jushi Hits Limit Up! Domestic Substitution Welcomes Golden Window
-

Focus on going global! kingfa sci. leads, huitong, preter, and kumho nire follow, china’s modified plastics frenziedly expanding worldwide
-

Back-to-back major joker moves! covestro’s 1.32 million ton mdi dual-line expansion and hdi acquisition reshape global polyurethane landscape
-

Evonik Parts Ways With The Polyester Business! A Strategic Retreat By A Germany Chemical Giant And The Global Industry Shift
-

PA66 Cost and Profit: Broad-Based Weakness in the Feedstock Market Continues to Erode Cost Support for PA66 (202606)


