


New Member Added to Domestic Polyethylene, Changing Regional Supply and Demand Pattern
Self2024Since the fourth quarter of the year, new domestic polyethylene plants have been launched intensively, leading to a significant increase in domestic polyethylene supply. Recently, with Inner Mongolia...3#The commissioning of the full density unit has further increased the domestic polyethylene production capacity to a new level.3621100 million tons, the domestic coal-to-capacity share increased to21%. With the continuous commissioning of new domestic installations, the supply landscape in various regions is undergoing changes.
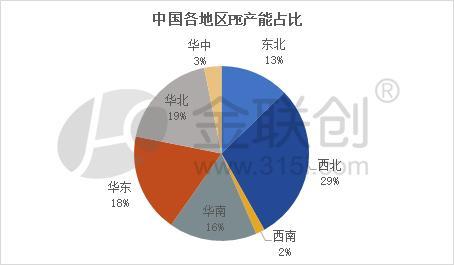
Data source: Jinlianchuan
From a regional perspective, with the commissioning of Inner Mongolia Baofeng's three full-density polyethylene units, the polyethylene production capacity in the Northwest region has exceeded 10 million tons, accounting for a significant share of the total capacity.29% , firmly ranking first in the country. Since2024Since the beginning of the year, with the successive commissioning of installations such as Sinopec-Shell, Yulong Petrochemical, Wanhua Chemical, and Shandong New Era, the production capacity in North China has increased most significantly, making it the second-largest supply region in the country. As of now, the production capacity in the North China region accounts for...19%After the Huajing Petrochemical in East China was put into production, its capacity accounted for the national total capacity.18%, ranked third. Sinochem Quanzhou High Pressure/EVAThe first conversion of the joint production facility to high pressure has resulted in a slight increase in capacity in the South China region.58910,000 tons, accounting for16%Ranked fourth. In recent years, there have been no new installations in the Northeast, Central China, and Southwest regions, with their respective production capacity shares at13%、3%、2%。
From the perspective of demand, East China and South China, with their superior geographical locations, have comparable polyethylene demand and are the two major regions for polyethylene consumption in China. Additionally, North China is also a significant consumer of polyethylene. There is a certain supply gap in these three major regions.
In recent years, changes in the domestic supply landscape have led to shifts in demand gaps across various regions. The Northwest and Northeast regions are traditional polyethylene production areas, with the Northwest being the largest production region. However, local demand and consumption are limited, accounting for only a small portion of the supply.20%, the demand in the northeastern region accounts for approximately40%The surplus supply from the two regions will mainly be allocated to North China and East China.2024As the polyethylene production capacity in North China rapidly increases, the local domestic supply grows quickly, significantly narrowing the supply gap and intensifying competition within the region. With the improvement of local resource self-sufficiency, there is a certain impact on external resources. The imported resources in East China and South China occupy a certain share, and after the ExxonMobil facility in South China begins operation, it will have a certain substitutive effect on imported resources.
In 2025, the domestic polyethylene industry will still be in a period of concentrated capacity expansion.818A 10,000-ton production capacity plan has been put into operation, further increasing the domestic self-sufficiency rate of polyethylene, while the domestic consumption growth rate is significantly lower than the supply growth rate.2025The domestic polyethylene market will present“Overcapacity, structural differentiation”Characteristics: competition in low-end general materials is intensifying, and import substitution for high-end materials still needs time. Enterprises need to keep up with policies and technological innovation, and seek growth points in niche markets.
【Copyright and Disclaimer】The above information is collected and organized by PlastMatch. The copyright belongs to the original author. This article is reprinted for the purpose of providing more information, and it does not imply that PlastMatch endorses the views expressed in the article or guarantees its accuracy. If there are any errors in the source attribution or if your legitimate rights have been infringed, please contact us, and we will promptly correct or remove the content. If other media, websites, or individuals use the aforementioned content, they must clearly indicate the original source and origin of the work and assume legal responsibility on their own.
Most Popular
-

AI Computing Power Demand Ignites Electronic Fabrics! China Jushi Hits Limit Up! Domestic Substitution Welcomes Golden Window
-

Focus on going global! kingfa sci. leads, huitong, preter, and kumho nire follow, china’s modified plastics frenziedly expanding worldwide
-

Back-to-back major joker moves! covestro’s 1.32 million ton mdi dual-line expansion and hdi acquisition reshape global polyurethane landscape
-

Evonik Parts Ways With The Polyester Business! A Strategic Retreat By A Germany Chemical Giant And The Global Industry Shift
-

PA66 Cost and Profit: Broad-Based Weakness in the Feedstock Market Continues to Erode Cost Support for PA66 (202606)


