


Net Profit Soars 80% VS Cash Flow Plummets 123%! What Information Does Nanjing Julong's Q3 Financial Report Reveal?
In the third quarter of the 2025 financial report disclosure season, Nanjing Julong (300644.SZ) delivered an impressive performance. The company achieved a revenue of 1.996 billion yuan in the first three quarters, marking a year-on-year increase of 23.78%. The net profit attributable to shareholders reached 101 million yuan, representing a significant year-on-year growth of 79.46%. The net profit excluding non-recurring items was 98.8999 million yuan, reflecting a year-on-year increase of 84.05%.
Image source: Nanjing Julong
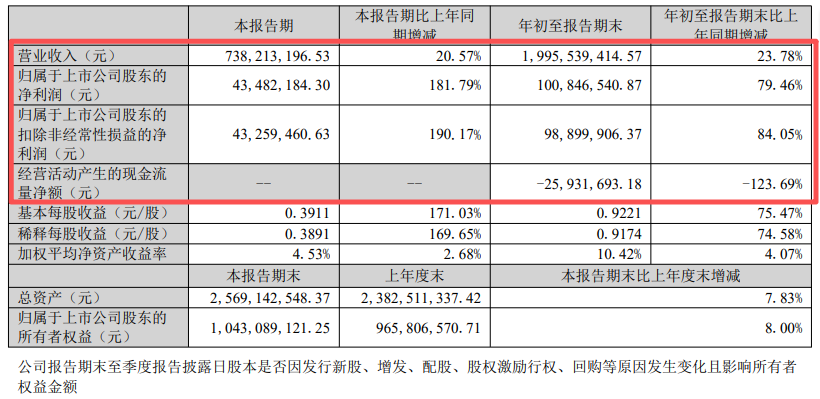
Image source: Nanjing Julong
In the third quarter alone, the performance growth was even more rapid, with net profit attributable to the parent company soaring 181.8% year-on-year to 43.48 million yuan. However, behind this seemingly impressive financial report lies a puzzling phenomenon: the significant "scissor gap" between the high profit growth and the sharp decline in net cash flow from operating activities. In the first three quarters, the company's net cash flow from operating activities was -25.93 million yuan, a substantial decrease of 123.69% year-on-year.
When the modified plastics industry benefits from trends such as automotive lightweighting and humanoid robots and overall improves, the industry segment leader Nanjing Julong shows a significant divergence between profit and cash flow. What is happening here? Specialized Plastics World provides you with an analysis.
01 Multiple Engine Drives Behind High Growth in Profits
Nanjing Julong's third-quarter financial report appears to be a celebration of profits on the surface, but in essence, it signifies a subtle shift in its growth model. A detailed breakdown of the profit sources reveals three key drivers: improved gross margin, optimized product mix, and cost control.
The financial report shows that Nanjing Julong's gross profit margin for the first three quarters of 2025 was 16.98%, an increase of 2.17 percentage points compared to the same period in 2024. Against the backdrop of fluctuations in raw material prices in the plastics industry, this increase reflects a significant upgrade in the company's product mix. The proportion of high-end products, such as long glass fiber reinforced materials and carbon fiber composite structural parts, has continued to rise, bringing higher brand premiums. Looking at the single quarter, the gross profit margin for the third quarter was 18.03%, up 2.93 percentage points year-on-year and 1.43 percentage points quarter-on-quarter, indicating a continued trend of improving profitability.
It is worth noting that the company's non-recurring net profit growth rate (84.05%) is higher than the attributable net profit growth rate (79.46%), indicating that the profit growth mainly comes from its core business rather than one-time gains. This suggests that Nanjing Julong's profit growth quality is relatively high, primarily stemming from the intrinsic growth of its main business, which is a positive signal.
The control of period expenses has also contributed to profit growth. In the first three quarters, the company's period expense ratio was 10.88%, a decrease of 0.34 percentage points compared to the same period last year. Among them, management expenses rose by 30.16% year-on-year, higher than the revenue growth rate, which may indicate that the company is increasing management investment in preparation for future expansion.
02 Asset Quality Concerns Behind Cash Flow Divergence
In stark contrast to the high growth in profits, Nanjing Julong's operating cash flow has significantly deteriorated. The net cash flow from operating activities for the first three quarters was -25.93 million yuan, a substantial decrease of 123.69% year-on-year, which forms a sharp contrast with the net profit of 101 million yuan.
This situation of "having profits but no cash" usually indicates an increase in accounts receivable, inventory backlog, or shortened supplier payment terms. Specialized analysis by Sights on Plastics found that Nanjing Julong's cash flow deterioration mainly stems from the increased use of working capital (accounts receivable (+62.17 million) and inventory (+36.82 million)).
At the same time, the company's debt-to-asset ratio has risen to 58.57%, an increase of 0.73 percentage points compared to the previous quarter, indicating that the company relies on debt financing for expansion. This is a normal phenomenon during a business expansion period, but it also increases financial risk. Especially in a rising interest rate cycle, high debt will lead to a rapid increase in financial expenses, eroding profits.
It is worth noting that at the end of the third quarter, the total number of shareholders in the company was 20,800, an increase of 7,388 compared to the end of the first half of the year, representing a growth of 54.91%. A significant increase in the number of shareholders often indicates a dispersion of shares, which may affect the stability of the stock price and reflects an increase in market divergence regarding the company.
03 Main Business Structure and Industry Position Analysis
According to the information, Nanjing Julong Technology Co., Ltd. is located at No. 8 Julong Road, Jiangbei New District, Nanjing, Jiangsu Province. It was established on April 27, 1999, and listed on February 6, 2018. The company's main business involves the research and development, production, and sales of high polymer new materials and their composite materials. The main business revenue composition is as follows: modified engineering plastics 45.34%, modified general-purpose plastics 35.59%, both accounting for more than 80%, which are the main sources of the company's revenue. In addition, long glass fiber reinforced materials 8.40%, plastic wood environmental engineering materials 6.42%, elastomer materials 2.10%, foam and others 0.90%, carbon fiber composite structural parts 0.74%, and trade goods 0.51%.
Source of the image: Nanjing Julong official website
The modified plastics industry in which the company operates has significant technological barriers and customer certification barriers. Once integrated into the customer supply chain, stable cooperative relationships can be established. The 23.78% revenue growth achieved by Nanjing Julong indicates that its market expansion has been effective and customer demand is strong.
It is encouraging that the company has continued to invest in research and development: R&D expenses increased by 21.94% year-on-year, roughly matching the revenue growth rate. As a high-tech enterprise, continuous investment in R&D is key to maintaining competitiveness. Nanjing Julong's R&D investment accounts for about 3% of its revenue, which is at a relatively high level in the industry.
The company's involved concept sectors include automotive lightweighting, humanoid robots, biodegradable materials, etc., which are current market hotspots. Especially under the trend of automotive lightweighting, the demand for high-performance plastics continues to grow, providing the company with a broad market space.
However, modified plastics companies generally face the awkward situation of having weak pricing power for upstream raw materials and strong bargaining power from downstream major customers. Although Nanjing Julong is a well-known company in plastic materials, its bargaining power in the industry chain still needs to be strengthened.
04 Opportunities and challenges coexist in the industry.
The trend of automotive lightweighting has brought growth opportunities to Nanjing Julong. According to industry data, by 2025, the market size of lightweight materials for automobiles in China will reach several hundred billion yuan, with the proportion of modified plastics continuing to increase.
"New energy vehicles have a more urgent demand for lightweighting, as reducing weight by 10% can increase the range by 6%-8%," said an automotive materials expert. "The application prospects of modified plastics in automotive interiors, exteriors, and around the engine are broad."
At the same time, the rise of the humanoid robot industry also brings new opportunities for companies. Tesla and other humanoid robot products have a huge demand for lightweight and high-strength materials, and Nanjing Julong already has the technical reserves to address this emerging market.
However, the company also faces severe challenges. The risk of upstream raw material price fluctuations always exists, and fluctuations in oil prices will directly affect the plastic industry. The prosperity fluctuations of the downstream automobile industry will also impact demand.
Moreover, intensified industry competition is also a risk that cannot be ignored. Large petrochemical companies are continuously extending into the downstream modified plastics sector, leveraging their scale and raw material advantages to exert pressure on specialized modified plastics companies.
Edited by: Lily
Source: Nanjing Julong, Sina Finance, You Lianyun, Wind, Caizhong News, etc.
【Copyright and Disclaimer】This article is the property of PlastMatch. For business cooperation, media interviews, article reprints, or suggestions, please call the PlastMatch customer service hotline at +86-18030158354 or via email at service@zhuansushijie.com. The information and data provided by PlastMatch are for reference only and do not constitute direct advice for client decision-making. Any decisions made by clients based on such information and data, and all resulting direct or indirect losses and legal consequences, shall be borne by the clients themselves and are unrelated to PlastMatch. Unauthorized reprinting is strictly prohibited.
Most Popular
-

AI Computing Power Demand Ignites Electronic Fabrics! China Jushi Hits Limit Up! Domestic Substitution Welcomes Golden Window
-

Focus on going global! kingfa sci. leads, huitong, preter, and kumho nire follow, china’s modified plastics frenziedly expanding worldwide
-

Back-to-back major joker moves! covestro’s 1.32 million ton mdi dual-line expansion and hdi acquisition reshape global polyurethane landscape
-

Evonik Parts Ways With The Polyester Business! A Strategic Retreat By A Germany Chemical Giant And The Global Industry Shift
-

PA66 Cost and Profit: Broad-Based Weakness in the Feedstock Market Continues to Erode Cost Support for PA66 (202606)


