


Major Shake-Up! Global Chemical Industry Slashes Production Capacity for "Self-Rescue," Largest Cutback in History
Seven plants in Europe have been permanently shut down! The scale of capacity reduction is unprecedented!
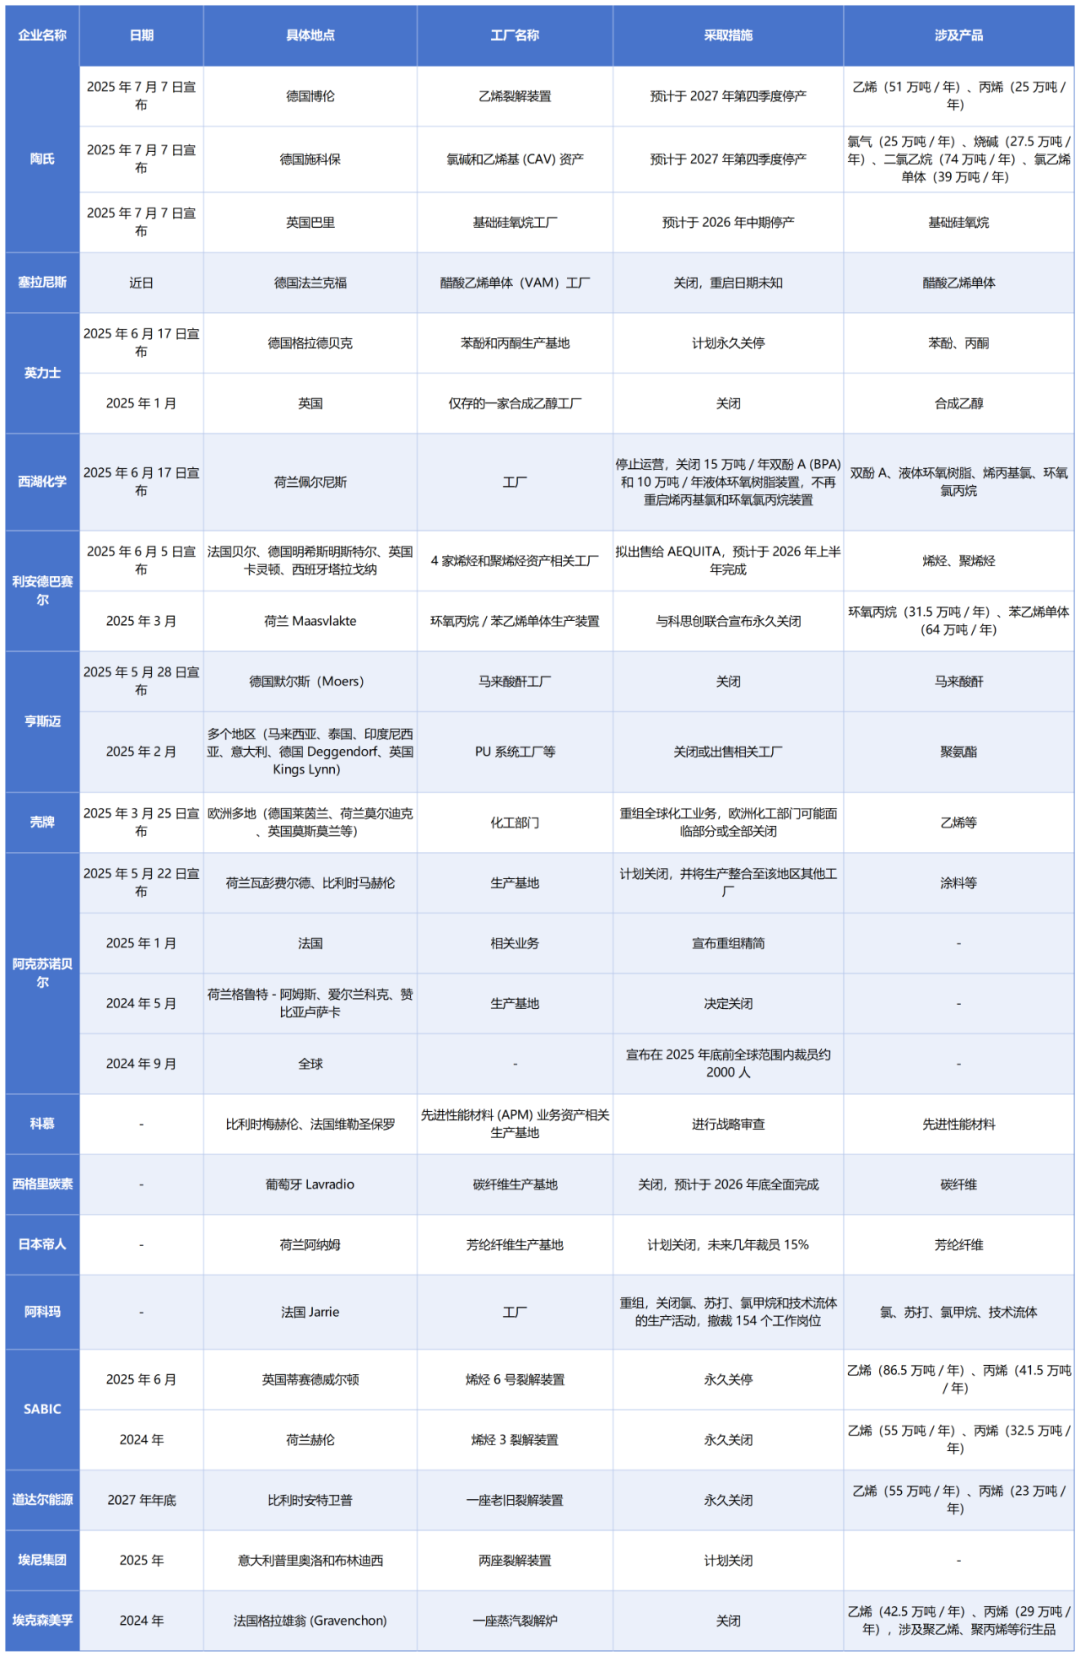
In the past 18 months, facing industry lows and short-term pessimistic expectations, European petrochemical producers have closed 7 steam cracking units. These 7 units, which have been permanently shut down or are planned to be closed by the end of 2027, have a combined ethylene capacity of approximately 4.5 million tons per year, propylene capacity of 2.3 million tons per year, and butadiene capacity of 430,000 tons per year.
Currently, Shell and SABIC plan to re-evaluate and optimize their European asset portfolio, covering four cracker units in the Netherlands, Germany, and the UK, with a total ethylene capacity of 2.6 million tons per year. BP is seeking buyers for its integrated refining and chemical assets in Gelsenkirchen, Germany. Dow plans to permanently shut down its 510,000 tons/year mixed-feed cracker in Böhlen, Germany by the fourth quarter of 2027, and has already idled the LCH3 unit in Terneuzen, the Netherlands in June due to economic reasons. TotalEnergies intends to close its 550,000 tons/year NC2 cracker in Antwerp by the end of 2027.
As the shutdown plan progresses, the number of existing ethylene plants in Europe is expected to fall below 50. Compared to 15 years ago, when there were 60 plants with a total design capacity of over 26 million tons per year, the forecast for 2029 indicates a capacity slightly above 22 million tons per year. In addition, European chemical companies are facing high energy costs and regional issues such as geopolitical conflicts leading to supply chain instability, forcing them to reduce production under multiple pressures.
The permanent closure of seven steam cracking units in the European olefins sector is not an isolated incident, but rather an important beginning of the capacity adjustment wave in the local chemical industry. This trend of production reduction has spread from the olefins segment to the entire industry chain, with more and more chemical companies, covering both upstream and downstream sectors, joining the production reduction camp. Eventually, this has resulted in a large-scale adjustment involving more than 20 companies and over 40 large units, with more than 15 million tons/year of capacity being included in shutdown plans. If the plans proceed as expected, by the end of 2027, Europe will permanently lose 4.6 million tons of ethylene, 2.28 million tons of propylene, and 430,000 tons of butadiene capacities, equivalent to the size of two world-class petrochemical bases in China.
Source*: Shengqi Chain
Notably, among the participants are leading industry enterprises, including ExxonMobil, LyondellBasell, Covestro, SABIC, Dow, Chemours, Shell, TotalEnergies, SGL Carbon, Lanxess, BASF, Westlake, Shengkiao, INEOS, Celanese, and Arkema—internationally renowned brands. These companies, leveraging their influence and leading positions within the industry, provide crucial guidance for the development direction of the entire industry chain and play an important role as "weather vanes."
The global wave of chemical production cuts continues to spread, with Japanese chemical companies also joining the industry adjustment trend. Several leading enterprises have successively announced the scaling back of their core businesses.
Mitsui Chemicals has announced that it will cease production of nitrogen trifluoride at its wholly-owned subsidiary, Shimonoseki Mitsui Chemicals, by the end of March 2026, and will end the sales of this product in the same year.
Asahi Kasei has introduced a more comprehensive production reduction plan: capacity will be phased down for four major businesses—MMA monomer, acrylic resin, CHMA, and SB latex—with plans to gradually cease production between 2026 and 2027, while also shutting down certain production lines at the Kawasaki Refining Plant.
Sumitomo Chemical has decided to shut down two of the three MMA monomer and PMMA production lines at its wholly-owned subsidiary, Sumitomo Chemical Asia, in Singapore.
COLILY announced the decision to reduce MMA annual production capacity by half, from 67,000 tons to 33,500 tons, and also decided to stop external sales of MMA.
Ube Industries, Ltd. announced the closure of one of its two nylon polymer production lines.
The capacity reduction of Japanese chemical companies is not a coincidental decision, but an inevitable choice under dual pressures from both internal and external factors. The core conflict is concentrated on two dimensions: market competition and cost control. For Japanese companies, this reduction is not merely a business contraction but a crucial step in strategic focus. Several leading companies have clearly planned to reduce the capacity of low value-added products while increasing research and capacity investment in high-barrier, high value-added fields such as carbon fiber and semiconductor photoresists. By optimizing their business structure through a "swap of capacity," they aim to further enhance overall profitability.
Faced with the global production reduction trend and domestic market pressure, the domestic chemical industry is advancing production cuts and maintenance simultaneously. In the polyester bottle chip industry, Yisheng Petrochemical, China Resources Materials, Sanfangxiang, and Wankai New Materials are leading companies in the industry. By the end of 2024, the combined production capacity of these four companies is approximately 15.49 million tons, with a concentration exceeding 80%, and the entire industry is operating at a loss in 2024. Recently, the industry leader Wankai New Materials announced plans to adjust the PET production plan and organize maintenance, involving a production capacity of 600,000 tons (accounting for 20% of its total capacity).
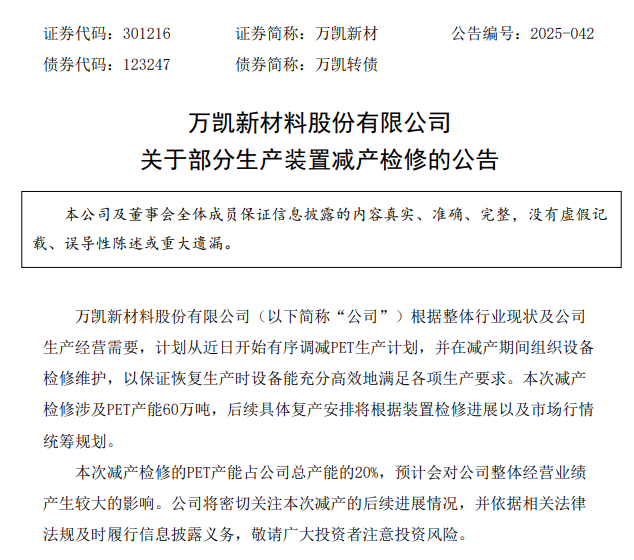
As early as April this year, Wankai New Material mentioned that the industry's average processing fee in 2024 would decrease by more than 30% year-on-year, leading to a significant decline in the company's gross profit. At the industry level, China's polyester bottle chip production capacity will exceed 30 million tons in 2024, while demand will be only about 25 million tons, resulting in an excess of 5 million tons. Some companies are facing a predicament of "losing 200 yuan per ton."
Wankai New Material's production cuts have initiated the first move against "involution" in the domestic industry, triggering a chain reaction. In June and July, starting from June 22, China Resources Chemical reduced production by 20% across three locations, affecting a capacity of 660,000 tons. Sanfangxiang halted production of a cumulative 1 million tons by the end of May, with no set date for resumption. Yisheng implemented production cuts starting July 1, with 750,000 tons halted at the Hainan base and 350,000 tons at the Dalian base. This concentrated production cut involves a total capacity of 3.36 million tons, accounting for 16.3% of the domestic total capacity. It is expected that the domestic polyester bottle chip operating rate will drop to around 75%, alleviating supply pressure.
The wave of production cuts in the global chemical industry is essentially a deep market correction following the intensification of excess capacity issues. This challenge has reached a critical stage where it must be addressed. Currently, sluggish global economic recovery has led to slower growth in downstream demand, exacerbating supply-demand imbalances. Some sectors have fallen into a vicious cycle of "overcapacity—price declines—profit deterioration," ultimately forcing the industry to shift from "scale expansion" to an adjustment cycle of "capacity reduction and structural optimization."
At the same time, the "anti-involution" competition in the chemical industry has fully escalated. Amidst overcapacity and weak demand, competition among companies has shifted from technical and quality contests to intense price and channel wars. Some companies are engaging in low-price bidding wars, leading to a continuous decline in industry profitability. "Reducing production to survive" has become a common choice. The industry's competitive logic has shifted from "increasing the pie" to "scrambling for the existing pie." Companies need to seek breakthroughs through technological upgrades and industrial chain integration.
The transmission effect of upstream production cuts is still permeating downstream, significantly affecting industries such as coatings and plastic processing. Meanwhile, the slowdown in real estate completions downstream and weak furniture exports have heightened the sensitivity of end-users to coating prices, making it difficult for companies to raise prices to pass on costs, thus falling into the dilemma of "rising costs, stable prices." The adjustment cycle in the chemical industry may continue in the future, and only by navigating this "major test" amid uncertainties such as geopolitical conflicts and energy price fluctuations can the opportunity for recovery be achieved.
【Copyright and Disclaimer】The above information is collected and organized by PlastMatch. The copyright belongs to the original author. This article is reprinted for the purpose of providing more information, and it does not imply that PlastMatch endorses the views expressed in the article or guarantees its accuracy. If there are any errors in the source attribution or if your legitimate rights have been infringed, please contact us, and we will promptly correct or remove the content. If other media, websites, or individuals use the aforementioned content, they must clearly indicate the original source and origin of the work and assume legal responsibility on their own.
Most Popular
-

AI Computing Power Demand Ignites Electronic Fabrics! China Jushi Hits Limit Up! Domestic Substitution Welcomes Golden Window
-

Focus on going global! kingfa sci. leads, huitong, preter, and kumho nire follow, china’s modified plastics frenziedly expanding worldwide
-

PA66 Cost and Profit: Broad-Based Weakness in the Feedstock Market Continues to Erode Cost Support for PA66 (202606)
-

Back-to-back major joker moves! covestro’s 1.32 million ton mdi dual-line expansion and hdi acquisition reshape global polyurethane landscape
-

Evonik Parts Ways With The Polyester Business! A Strategic Retreat By A Germany Chemical Giant And The Global Industry Shift


