


Latest Release: Rubber and Plastic Products Industry Up 6.3% YoY from January to August, Automobile Production Surges Over 10%
In August 2025, the value added of China's large-scale industries increased by 5.2% year-on-year, continuing to maintain a steady growth trend. Within this overall stable performance, there was a marked divergence among different industries. In particular, the production and sales data of the plastics and chemical industry and its key downstream sector—the automotive manufacturing industry—stood out, clearly outlining the supporting role of upstream industries and the driving force from downstream sectors along the industrial chain.
Please provide the content you would like to have translated.The overall industry operates steadily, with high-tech manufacturing continuing to lead.
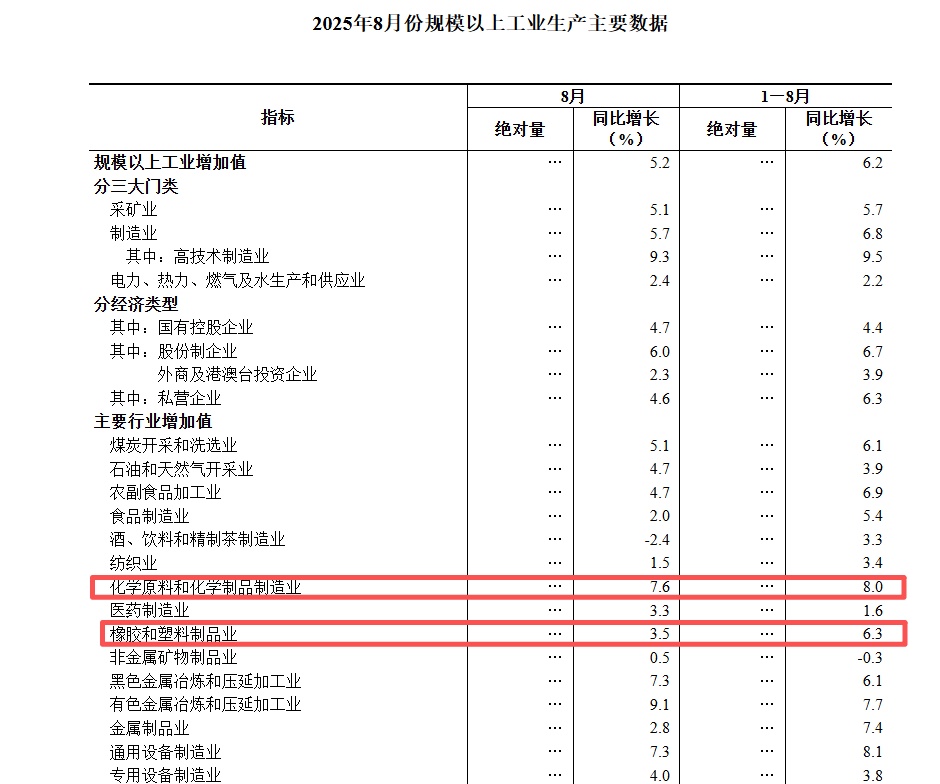
Looking at the data for August, industrial production showed the characteristics of “steady progress and structural optimization.” Not only did the year-on-year growth rate remain above 5%, but the cumulative growth rate from January to August also reached 6.2%, demonstrating strong growth resilience. Among the major sectors, manufacturing grew by 5.7%, making it the fastest-growing sector and continuing to play its role as the backbone of the industry.
Particularly noteworthy is thatThe added value of the high-tech manufacturing industry increased by 9.3% year-on-year.The growth rate is significantly higher than the overall industrial scale by 4.1 percentage points, with the cumulative growth rate from January to August reaching 9.5%. This indicates that China's economic structural transformation and momentum conversion are continuing to deepen, with high-end manufacturing becoming the core engine of industrial growth. This macro background provides a favorable development environment for technology-intensive industries such as the plastic chemical and automotive sectors.
2.Plastic Chemical Industry: Rapid Growth in Raw Materials Segment, Steady Growth in Finished Products Segment
The performance of the plastic chemical industry needs to be analyzed from the perspective of the industry chain. Data clearly shows the different levels of activity between upstream and downstream.
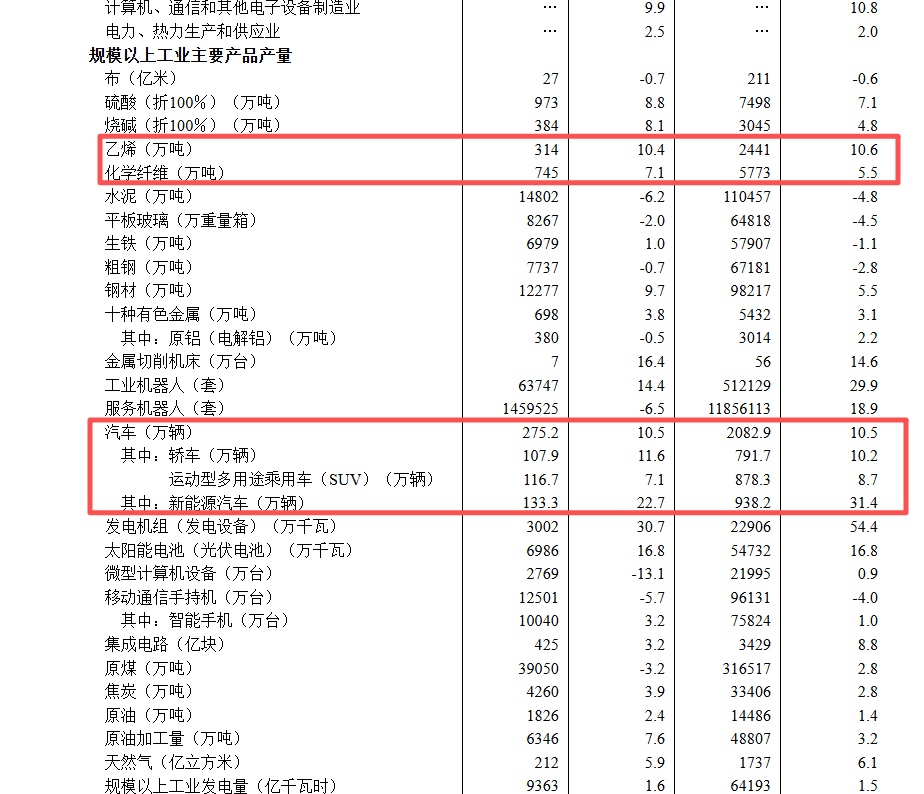
Firstly, the production of upstream basic chemical raw materials is thriving, and demand is strong.As one of the most critical raw materials in the plastics industry, The output reached 3.14 million tons in August, a significant year-on-year increase.10.4%Cumulative production from January to August reached 24.41 million tons, with a high growth rate.10.6%The rapid growth in ethylene production directly reflects the strong demand from downstream markets for synthetic resins (such as polyethylene, polyvinyl chloride, etc.). Output (at 100%): Production increased by 8.8%. (At 100% capacity) Output increased by 8.1%. The strong growth of these basic chemicals collectively confirms that the entire chemical industry is currently experiencing a period of high prosperity.
Secondly, the chemical raw materials and chemical products manufacturing industry in the midstream sector performed remarkably well.In August, the value added increased year-on-year.7.6%It is one of the industries with relatively high growth among the 41 major categories, with a cumulative growth rate of 8.0% from January to August, showing a stable momentum. The prosperity of this industry provides ample and potentially more price-stable raw material supply for the downstream plastic products industry.
Finally, focus on those that are directly relevant.Rubber and Plastic Products IndustryThe value added in August increased year-on-year.3.5%From January to August, the cumulative growth was 6.3%. Although the growth rate was not as high as that of the upstream raw materials industry, it still maintained a steady expansion trend. This difference in growth rates is reasonable: the upstream sector benefits from multiple downstream industries (including plastics, textiles, building materials, etc.), while the rubber and plastic products industry more directly reflects the demand conditions of its primary downstream sectors—automobiles, home appliances, packaging, and others.
Sure! However, I do not see the content you would like me to translate. Please provide the text you want translated, and I will translate it into English for you.Automotive Industry: Strong Production and Sales, New Energy Vehicles Leading the Transformation
As one of the most important downstream application fields of the plastics and chemical industry (automobiles are the third largest application area for plastics, after packaging and construction materials), the automobile manufacturing industry delivered a remarkable performance in August, perfectly demonstrating its strong driving effect on upstream chemical materials.
1. High-speed growth on the production side:AugustAutomobile Manufacturing IndustryValue-added year-on-year growth8.4%...far exceeding the industrial average level. The cumulative growth rate from January to August has reached...10.5%It demonstrates a very high level of production activity.
2. Production data confirms prosperity:In August, the country produced a total of275.2 Automobile, year-on-year growth10.5%Among them,New energy vehiclesOutput reached133.3 Year-on-year growth22.7%As of August, the share of new energy vehicles in the total automobile production has reached 48.4%, nearly half of the total. From January to August, the cumulative production of new energy vehicles has reached...938.2 YoY surged31.4%This indicates that China's automotive industry is not only expanding in total volume but is also rapidly transforming in structure towards electrification and intelligence.
3. Product Structure OptimizationIn the traditional fuel vehicle sector, sedans (up by 11.6%) and SUVs (up by 7.1%) also maintained growth, indicating a comprehensive recovery in consumer demand.
The vigorous development of the automotive industry, especially the substantial growth of new energy vehicles, has had a profound impact on the plastic and chemical industry.
- Lightweight requirementsThe pursuit of range in new energy vehicles has made lightweight solutions that replace steel with plastic a necessity. This not only increases the amount of plastic used per vehicle (especially engineering plastics, composite materials, and other high-performance materials), but also drives innovation and upgrades in material technology.
- Specific component incrementThe three electric systems (battery, electric motor, electronic control) of new energy vehicles require a large amount of special plastics and insulating materials, such as battery pack housings, wire harness insulation materials, and charging pile components, creating a new incremental market.
- High-end trendConsumers' increasing demands for higher quality and technological sophistication in automotive interiors have driven the demand for high-end plastic materials with better appearance, improved tactile feel, and superior performance.
Sure! Please provide the content you would like me to translate into English.Collaboration and Future Challenges
The industrial data from August clearly depicts a picture of...“Ensuring the supply of chemical raw materials and driving demand through the automotive industry.The collaborative development landscape of the industrial chain. The high growth of upstream chemical industries, particularly in raw materials like ethylene, has provided a solid foundation for downstream automobile production. Meanwhile, the explosive growth of downstream automobiles, especially new energy vehicles, has created a vast market space and impetus for product upgrades for the upstream chemical industry.
However, beneath the prosperity, potential challenges must also be addressed. In August, the above-designated size industrial enterprises'The nominal value of export delivery decreased by 0.4% year-on-year.This indicates that the external demand environment remains complex and severe. For the plastic and automotive industries, which are deeply integrated into the global supply chain, it is necessary to be alert to the risks brought by fluctuations in overseas markets. Industry competition is intensifying. The fierce price war in the automotive sector inevitably drives cost pressures up the supply chain, placing higher demands on plastic and chemical companies’ cost control and technology-driven cost reduction capabilities. Price fluctuations of raw materials (such as crude oil prices) remain an uncertainty factor for the profitability of the chemical industry.
Overall, the industrial data from August 2025 indicate that China’s plastics and chemical industry and the automotive sector—especially the new energy vehicle segment—are forming a deeply positive and mutually reinforcing cycle. The robust recovery and structural upgrading of the automotive industry are currently key drivers of growth for the plastics and chemical sector; meanwhile, technological advancements and stable supply from the chemical industry provide a solid foundation for innovation and development in the automotive sector.
Looking ahead, the future development of the two major industries will rely even more onTechnological InnovationandIndustry chain collaborationChemical companies need to keep up with the trends of electrification and intelligence in the automotive industry by developing more high-performance, lightweight new material solutions. Meanwhile, automotive companies should establish closer cooperation with upstream material suppliers to jointly address cost pressures and market challenges. Only in this way can they consolidate their advantages in fierce global competition and achieve high-quality development.
Source: National Bureau of Statistics
All images in the text are sourced from the National Bureau of Statistics.
【Copyright and Disclaimer】This article is the property of PlastMatch. For business cooperation, media interviews, article reprints, or suggestions, please call the PlastMatch customer service hotline at +86-18030158354 or via email at service@zhuansushijie.com. The information and data provided by PlastMatch are for reference only and do not constitute direct advice for client decision-making. Any decisions made by clients based on such information and data, and all resulting direct or indirect losses and legal consequences, shall be borne by the clients themselves and are unrelated to PlastMatch. Unauthorized reprinting is strictly prohibited.
Most Popular
-

AI Computing Power Demand Ignites Electronic Fabrics! China Jushi Hits Limit Up! Domestic Substitution Welcomes Golden Window
-

Focus on going global! kingfa sci. leads, huitong, preter, and kumho nire follow, china’s modified plastics frenziedly expanding worldwide
-

PA66 Cost and Profit: Broad-Based Weakness in the Feedstock Market Continues to Erode Cost Support for PA66 (202606)
-

Back-to-back major joker moves! covestro’s 1.32 million ton mdi dual-line expansion and hdi acquisition reshape global polyurethane landscape
-

Evonik Parts Ways With The Polyester Business! A Strategic Retreat By A Germany Chemical Giant And The Global Industry Shift


