


National Bureau of Statistics Data Released! "Increasing Revenue Without Corresponding Profit Growth" in Rubber & Plastic Industry? Decoding the Mystery of Profit Divergence in Manufacturing in H1 202
Latest data from the National Bureau of Statistics shows that from January to June 2025, industrial enterprises above designated size nationwide achieved total profits of 3.4365 trillion yuan, a year-on-year decrease of 1.8%. However, the manufacturing sector achieved total profits of 2.59006 trillion yuan, a year-on-year increase of 4.5%, becoming a key pillar of the industrial economy. Notably, manufacturing profits in June turned from a 4.1% decline in May to a 1.4% growth, indicating a stabilizing and recovering trend. From the perspective of sub-sectors, the rubber and plastic products, automobile manufacturing, and consumer electronics industries showed differentiated development characteristics.
Source: National Bureau of Statistics
Rubber and Plastic Products Industry Operating Under Pressure
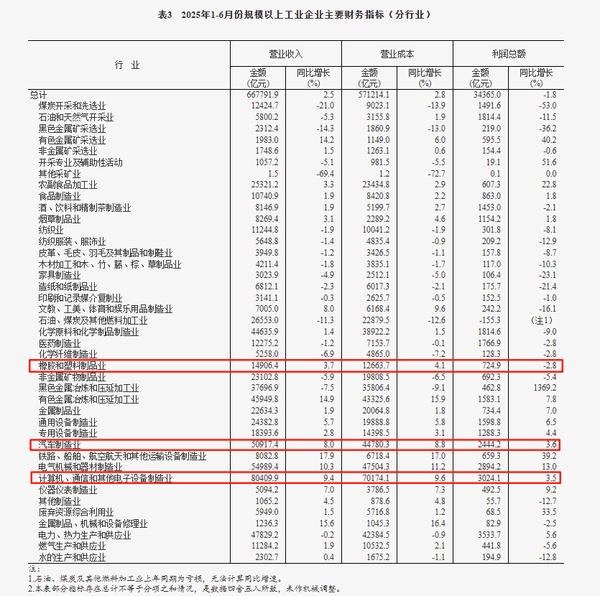
Source: National Bureau of Statistics
Industry Fundamentals: The rubber and plastic products industry achieved total profits of 72.49 billion yuan, a year-on-year decrease of 2.8%, performing weaker than the overall manufacturing sector. From January to June 2025, the cumulative operating revenue of the rubber and plastic products industry reached 1.49064 trillion yuan, a cumulative increase of 3.7%. However, revenue growth failed to effectively translate into profit improvement, leaving the industry in an overall predicament of "increasing revenue without corresponding profit growth." This situation is mainly due to the dual pressure of rising costs and falling product prices, which is also intuitively reflected in the data. From January to June 2025, the operating costs of the rubber and plastic products industry reached 1.26637 trillion yuan, a year-on-year increase of 4.1%, outpacing the industry's revenue growth during the same period, indicating significant cost pressures. Meanwhile, product manufacturers struggled to fully pass on rising costs to downstream customers, leading to compressed profit margins. This imbalanced profit distribution between upstream and downstream sectors has put the rubber and plastic products industry at a disadvantage in the industrial chain.
Divergent Performance Across Application Sectors
In the first half of the year, among sub-sectors of manufacturing, the automobile manufacturing industry and the computer and communication equipment manufacturing industry stood out, with total profits of 244.42 billion yuan (+3.6%) and 302.41 billion yuan (+3.5%) respectively, leading industrial growth. In June alone, 4 out of 8 sectors in the equipment manufacturing industry saw profit growth. Among them, driven by factors such as rapid sales growth due to carmaker promotions and increased investment income of key enterprises, profits in the automobile industry surged by 96.8%; profits in electrical machinery, instrumentation, and metal products industries grew by 18.7%, 12.3%, and 6.2% respectively. Below is a brief analysis of the automobile manufacturing and consumer electronics industries.
1. Automobile Manufacturing Industry Leading Strongly
As a pillar industry of the national economy, the automobile manufacturing industry demonstrated strong growth momentum in the first half of 2025. Particularly in June alone, profit growth soared to 96.8%, hitting a new high for monthly growth in recent years. This explosive growth was mainly driven by the continuous effectiveness of the national "trade-in" policies and the rapid penetration of the new energy vehicle (NEV) market. In the first half of 2025, the national NEV penetration rate exceeded 45%, an increase of 12 percentage points compared to the same period in 2024, driving upgrading and expansion of the entire automobile industry chain. Driven by vehicle manufacturers, demand for automotive plastic parts showed explosive growth, especially with the significantly increased application proportion of lightweight materials such as polypropylene (PP) and polyamide (PA) in engineering plastics for battery casings, interior parts, bumpers, and other components. Industry estimates suggest that the average plastic usage per NEV is higher than that of traditional fuel vehicles. With the rising NEV penetration rate, the market scale of automotive plastic parts is expected to further expand.
2. Continuous Recovery in Consumer Electronics
The computer, communication, and other electronic equipment manufacturing industry showed a steady recovery trend in the first half of 2025, with computer 整机 manufacturing growing by 97.2% in June alone, becoming another key driver of manufacturing growth. This growth trajectory aligns with the recovery trend in the global consumer electronics market and reflects China's strong competitiveness and industrial chain advantages in consumer electronics manufacturing. In the first half of 2025, as inflationary pressures eased in major economies and consumer confidence recovered, global shipments of smartphones, tablets, personal computers, and other electronic products all achieved positive growth. According to a report by International Data Corporation (IDC), global smartphone shipments grew by 6.8% year-on-year in the second quarter, ending seven consecutive quarters of decline. As the world's largest electronics producer, China naturally became a major beneficiary of this recovery. The recovery in consumer electronics directly drove demand for supporting components such as plastic casings and insulating materials, with the proportion of high-value-added products such as modified plastics and environmentally friendly materials continuing to rise.
Ongoing Effectiveness of Consumer Goods Trade-in Policies
Analysis shows that the effectiveness of the "Two News and Two Keys" (focusing on new products, new models, key areas, and major projects) policies has been reflected in industrial enterprise profits, with rapid profit growth in electronics, home appliances, kitchen and bathroom, and other industries. In June, profits in smart unmanned aerial vehicle manufacturing, computer 整机 manufacturing, household air conditioner manufacturing, and household ventilation appliance manufacturing grew by 160.0%, 97.2%, 21.0%, and 9.7% respectively; profits in related sectors such as optoelectronic device manufacturing and computer component manufacturing increased by 29.6% and 16.9% respectively.
Trade-in policies for consumer goods have been an important measure to boost consumption this year. Wu Gai, Deputy Director of the Economic Construction Department of the Ministry of Finance, recently stated that in the first half of the year, trade-in work for consumer goods achieved positive results, with sales of automobiles, home appliances, home decoration, mobile phones, and other commodities reaching 1.6 trillion yuan. Retail sales of home appliances and audio-visual equipment, cultural office supplies, communication equipment, and furniture by enterprises above designated size increased by 30.7%, 25.4%, 24.1%, and 22.9% year-on-year respectively, driving a 5% year-on-year growth in total retail sales of consumer goods.
Summary
The development of the rubber and plastic products industry is affected by both upstream and downstream sectors due to its position in the industrial chain. On one hand, strong demand from high-growth industries such as automobiles and electronics provides a broad market for related plastic products; on the other hand, fluctuations in raw material prices and higher environmental requirements bring cost pressures to enterprises. Under such circumstances, product innovation and process upgrading have become key for enterprises to break through difficulties.
Overall, the rubber and plastic products industry is expected to show the following development trends in the future: first, continuous optimization of product structure with an increasing proportion of high-end plastic parts; second, accelerated technological innovation with continuous improvement in material performance and process levels; third, deepened green transformation with expanded application of environmentally friendly materials and energy-saving processes; fourth, strengthened industrial chain collaboration for joint development with downstream industries such as automobiles and electronics. Supported by national policies and guided by market demand, the rubber and plastic products industry is expected to achieve steady improvement in quality and efficiency during adjustments, providing strong support for high-quality development of the manufacturing sector.
Editor: Lily
【Copyright and Disclaimer】This article is the property of PlastMatch. For business cooperation, media interviews, article reprints, or suggestions, please call the PlastMatch customer service hotline at +86-18030158354 or via email at service@zhuansushijie.com. The information and data provided by PlastMatch are for reference only and do not constitute direct advice for client decision-making. Any decisions made by clients based on such information and data, and all resulting direct or indirect losses and legal consequences, shall be borne by the clients themselves and are unrelated to PlastMatch. Unauthorized reprinting is strictly prohibited.
Most Popular
-

AI Computing Power Demand Ignites Electronic Fabrics! China Jushi Hits Limit Up! Domestic Substitution Welcomes Golden Window
-

Focus on going global! kingfa sci. leads, huitong, preter, and kumho nire follow, china’s modified plastics frenziedly expanding worldwide
-

Back-to-back major joker moves! covestro’s 1.32 million ton mdi dual-line expansion and hdi acquisition reshape global polyurethane landscape
-

Evonik Parts Ways With The Polyester Business! A Strategic Retreat By A Germany Chemical Giant And The Global Industry Shift
-

PA66 Cost and Profit: Broad-Based Weakness in the Feedstock Market Continues to Erode Cost Support for PA66 (202606)


