


Hasbro Q2 Earnings Announced, Production And Sales From China To United States Resume In May
"Recovery in the first half of 2025 has fully demonstrated the significant effectiveness of the 'Winning Plan' strategy," stated Chris Cocks, CEO of Hasbro. "Magic: The Gathering achieved its best performance in history, with board game product portfolio, licensing partnerships, and digital initiatives working synergistically. Based on the current momentum, we are raising our full-year expectations, laying the foundation for sustained growth in 2025 and beyond."
 In-depth Analysis of Business Segments
Consumer products: Revenue declined by 16% (mainly due to order cycles and regional fluctuations), but core brands such as "Beyblade," "Transformers," and "Monopoly" showed growth against the trend. Licensing business continued to perform well, with adjusted operating profit of 1.2 million USD.
Entertainment segment: Revenue decreased by 15% (affected by transaction cycles), adjusted operating profit fell to $10 million.
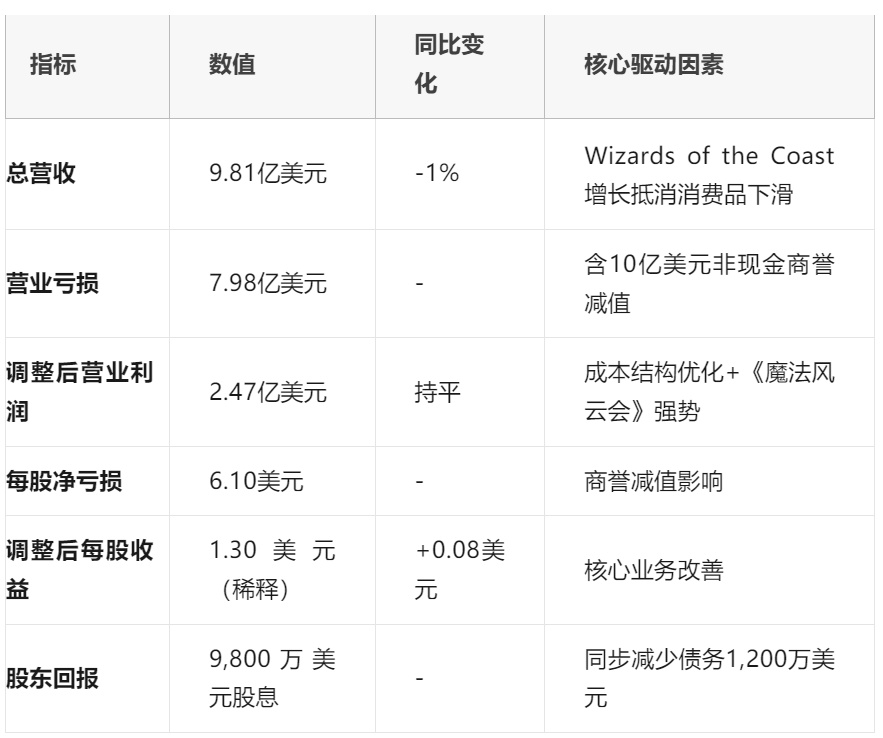
Financial Metrics Overview
The company recorded an operating loss of $798 million (primarily due to a $1 billion non-cash goodwill impairment), but adjusted operating profit remained stable at $247 million. The net loss per share was $6.10, and diluted earnings per share were $1.30 (an increase of $0.08 year-over-year).
Key Data for the Second Quarter of 2025
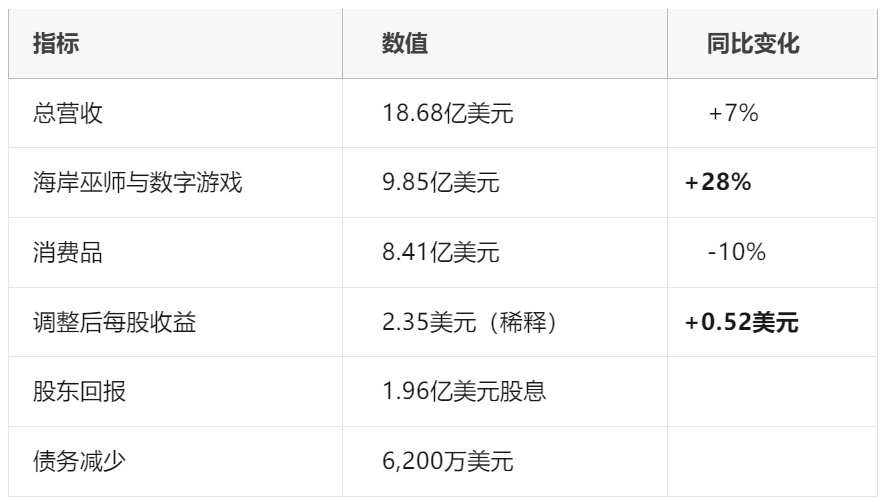
Key Data for the First Half of the Year
Cumulative revenue increased by 7% to $1.87 billion: Wizards of the Coast and digital gaming surged by 28%, offsetting a 10% decline in consumer products. $98 million was returned to shareholders this quarter, and debt was reduced by $12 million.
Cumulative Performance in the First Half of 2025
"The strong performance of Wizards of the Coast has led us to raise our full-year revenue and adjusted EBITDA guidance," said CFO Gina Gotthold. "Despite macroeconomic fluctuations, our diversified business layout and cost control measures support the revised expectations."
Trade war impact
With the tariff rate reduced from a temporary 145% to 30%, Hasbro resumed production and sales from China to the United States in May. In Q2, owned inventory surged 17% year-on-year (due to planned stocking and increased inventory costs caused by exchange rates and tariffs), but slow-moving inventory dropped to a historic low. The company stated that tariffs have not yet impacted profit margins, but "cost pressures are expected to emerge in the third quarter alongside the holiday stocking season."
Foresight Dynamics
At last week's New York Toy Fair, Hasbro showcased several heavyweight products expected to ignite the market. The company will hold its earnings call at 8:30 AM Eastern Time this morning.
【Copyright and Disclaimer】The above information is collected and organized by PlastMatch. The copyright belongs to the original author. This article is reprinted for the purpose of providing more information, and it does not imply that PlastMatch endorses the views expressed in the article or guarantees its accuracy. If there are any errors in the source attribution or if your legitimate rights have been infringed, please contact us, and we will promptly correct or remove the content. If other media, websites, or individuals use the aforementioned content, they must clearly indicate the original source and origin of the work and assume legal responsibility on their own.
Most Popular
-

AI Computing Power Demand Ignites Electronic Fabrics! China Jushi Hits Limit Up! Domestic Substitution Welcomes Golden Window
-

Focus on going global! kingfa sci. leads, huitong, preter, and kumho nire follow, china’s modified plastics frenziedly expanding worldwide
-

PA66 Cost and Profit: Broad-Based Weakness in the Feedstock Market Continues to Erode Cost Support for PA66 (202606)
-

Back-to-back major joker moves! covestro’s 1.32 million ton mdi dual-line expansion and hdi acquisition reshape global polyurethane landscape
-

Evonik Parts Ways With The Polyester Business! A Strategic Retreat By A Germany Chemical Giant And The Global Industry Shift


