


Global domination in battery materials! battery separator giant enjie shares reports losses, overseas expansion becomes key
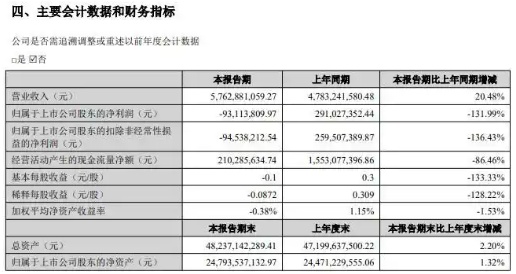
According to Zhuan Su Shi Jie on August 19, Yunnan Energy New Material Co., Ltd. disclosed its semi-annual report showing that the company achieved an operating revenue of 5.763 billion yuan in the first half of the year, a year-on-year increase of 20.48%. However, the net profit attributable to shareholders of the listed company was a loss of 93.114 million yuan, a year-on-year decrease of 131.99%, in stark contrast to the profit of 291 million yuan in the same period last year.
The loss is mainly due to the decline in the gross profit margin of lithium battery separator products, the temporary loss status of new business segments such as aluminum-plastic film and dry-process separators, the increased costs of overseas base construction, and inventory impairment provisions. Despite this, Enjie Co., Ltd. still aims to...With a loading capacity of 1.993 billion square meters, maintaining a leading position in the global market, its performance volatility reflects the opportunities and challenges faced by Chinese battery material companies in their global expansion.
Source: Enjie Co., Ltd.
China's dominance in the global battery material industry is reinforced.
Enjie Co., Ltd.Facing losses, but still unable to preventChina's Dominance in Four Major Battery Materials Consolidated GloballySpecialized Vision DiscoveryIn the first half of 2025, Chinese companies have established an overwhelming advantage in the four core materials of global power batteries.
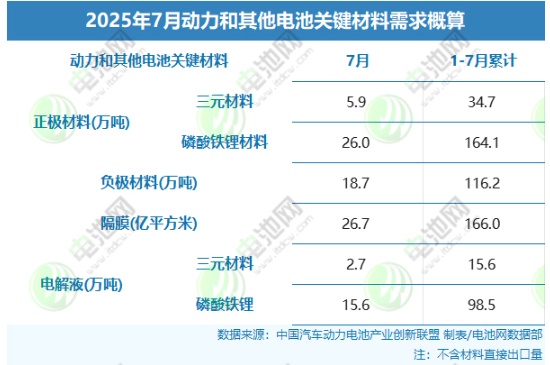
Positive Electrode Material: Global Loading Volume110.56 million tons, a year-on-year increase of 42.6%. Among them, lithium iron phosphate materials accounted for 58%, with Chinese companies such as Hunan Yuneng and Defang Nano taking the top four positions, forming a "China-centered" pattern. In the ternary materials sector, companies like Ronbay Technology and Beijing Easpring Material Technology are competing with Korean companies such as LG Chem and POSCO, but Chinese companies are experiencing more rapid growth.
Negative electrode materials: Global loading==59.38 million tons, with Chinese companies accounting for 95% of the total. Shanshan Co., Ltd. and BTR lead with a loading capacity of over 100,000 tons. Companies like Shantech and Kaijin Energy have achieved year-on-year growth rates of 40%-70%. Collaboration between silicon-based composite anode materials and mainstream battery manufacturers is deepening.
Electrolyte: Global Loading Volume61.6 million tons, with Chinese companies accounting for 87.3%. Tianqi Materials, BYD, and Capchem ranked the top three, with significant year-on-year growth in loading volume. The market share of Korean companies Enchem and SBH has been further squeezed.
Membrane: Global Loading Capacity7.69 billion square meters, with Chinese companies accounting for nearly 90%. Enjie Co., Ltd. ranks first with a loading capacity of 1.993 billion square meters, while companies like Senior Material and Sinoma Technology have growth rates exceeding 30%. The combined market share of Japanese and Korean companies is less than 12%.
Source: Battery Network
The Chinese battery industry chain has formed a closed-loop ecosystem from mineral development and material preparation to end-use applications, with a full-chain advantage supporting its dominant position in the global market.
Enjie Co., Ltd.: The Dilemma of the Industry Leader and Structural Challenges
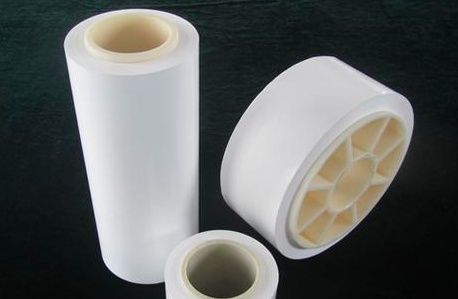
As one of the four core materials of lithium batteries, the separator industry has high technical barriers and is capital intensive, and the global market has long shown...The "one superpower, many strong contenders" competitive landscape. According to GGII data, the global shipment of lithium battery separators is expected to exceed 30 billion square meters by 2025, with a compound annual growth rate of over 25%, among which wet process separators will account for more than 80%.。
Enjie Co., Ltd., leveraging its technical accumulation and production capacity advantages, nearly...90% of the global wet-process separator market share has solidified its leading position. As the global leader in separators,Zhuan Su Shijie believesEnjie Co., Ltd.'s performance in the first half of the year was under pressure due to multiple factors.
Gross profit margin decline: Increased competition in lithium battery separator products leads to price pressure and a decrease in gross profit margin.
New business losses: Forward-looking businesses such as aluminum plastic film and dry process separator are still in the investment phase and are unlikely to contribute to profits in the short term.
Overseas Deployment Costs: To meet global market demand, the company is accelerating the construction of overseas bases in Hungary, the United States, and other locations, leading to increased operating expenses.
Inventory write-downs: Based on the principle of prudence, inventory write-downs are made to further compress profit margins.
Despite this, Enjie Co., Ltd. still nearlyHolding 90% of the global separator market share demonstrates its industry position, but the intense competition in the domestic market and the lengthy certification process for overseas customers compel it to seek new growth poles.
Path to Breakthrough: Accelerating Expansion Overseas as the Key to Success
The power battery industry is facing a decline in raw material lithium carbonate prices and downstream car manufacturers.Under the dual pressure of a "price war" and increasingly severe "involution" situation, the speed of capacity reduction has accelerated. To meet this challenge, Chinese power battery companies are actively seeking ways out, among which accelerating the expansion of overseas markets has become...Battery material companies represented by Enjie Co., Ltd.Important choice.
Source: Car Quality Network
Global Capacity Layout: Enjie Co., Ltd.'s Hungary base has entered the equipment commissioning stage, and the U.S. base is planned.Planned to start production in 2026, aiming to be closer to overseas customers, reduce logistics costs, and circumvent trade barriers.
With technological advantages in lithium iron phosphate and high-end separators, Chinese companies are participating in the formulation of international standards to enhance their influence abroad.
Localization collaboration: Through collaboration withLG New Energy, Tesla, and other overseas clients are jointly building production capacity to deepen supply chain integration. For example, CATL's factories in Germany and Hungary have already achieved localized production.
Emerging market penetration: The demand for new energy vehicles in regions such as Southeast Asia and Latin America is surging, and Chinese companies are leveraging this trend to expand their sales networks, forming a second growth curve.
Epilogue:
Industry analysts point out that profit margins in overseas markets are generally higher than those in domestic markets.The demand growth rate is 5-10 percentage points faster than domestically, and accelerating overseas expansion will become the core strategy for Chinese battery material companies to maintain their global leading position.
【Copyright and Disclaimer】This article is the property of PlastMatch. For business cooperation, media interviews, article reprints, or suggestions, please call the PlastMatch customer service hotline at +86-18030158354 or via email at service@zhuansushijie.com. The information and data provided by PlastMatch are for reference only and do not constitute direct advice for client decision-making. Any decisions made by clients based on such information and data, and all resulting direct or indirect losses and legal consequences, shall be borne by the clients themselves and are unrelated to PlastMatch. Unauthorized reprinting is strictly prohibited.
Most Popular
-

AI Computing Power Demand Ignites Electronic Fabrics! China Jushi Hits Limit Up! Domestic Substitution Welcomes Golden Window
-

Focus on going global! kingfa sci. leads, huitong, preter, and kumho nire follow, china’s modified plastics frenziedly expanding worldwide
-

PA66 Cost and Profit: Broad-Based Weakness in the Feedstock Market Continues to Erode Cost Support for PA66 (202606)
-

Back-to-back major joker moves! covestro’s 1.32 million ton mdi dual-line expansion and hdi acquisition reshape global polyurethane landscape
-

Evonik Parts Ways With The Polyester Business! A Strategic Retreat By A Germany Chemical Giant And The Global Industry Shift


