


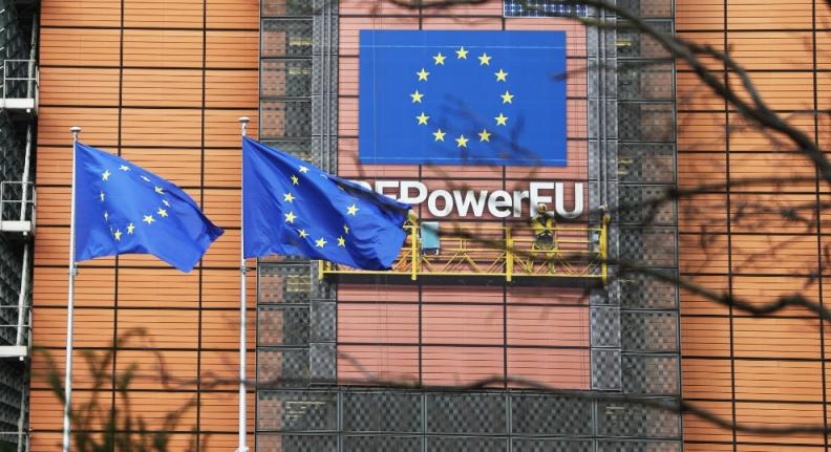
EU's 18th Round of Sanctions Against Russia, India's 33% Re-Export Trade of Russian Oil Fully Frozen
On July 18, 2025, the EU High Representative for Foreign Affairs and Security Policy, Kallas, stated on social media that the EU member states had officially approved the 18th round of sanctions against Russia that day.Previously, due to concerns that banning the import of Russian energy would impact its own economy, Slovakia had opposed this round of sanctions six times. However, after receiving assurances from the EU regarding potential assistance with natural gas shortages, price increases, and transportation costs, Slovakia ultimately changed its stance and approved the sanctions against Russia.18 rounds of sanctions measures.
One of the core measures of this round of sanctions is changing the price cap on Russian oil from a fixed level.Adjusted from $60 per barrelFloating mechanism, initially set as$47.6 per barrel.The price cap will be assessed every six months to ensure it is always lower than the market average price.15%. Due toRussian energy revenue as a share of the federal budget More than 35%ThereforeThis move aims to continue to squeezeRussiaFiscal space forces Russia to export crude oil at even lower discounts.
Comparison of the prices of Russian Urals crude oil and Brent crude oil over 5 years
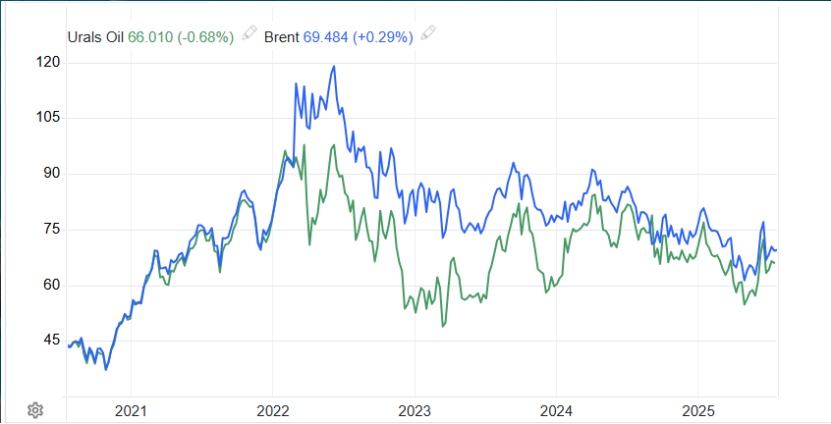
Previously, in response to the ongoing sanctions from the European market, Russia has shifted the focus of its energy exports towards Asia.In 2025, Russia's crude oil exports to the Far East (including China) will reach 120 million tons, accounting for approximately 35% of its total exports; among natural gas exports, pipeline gas and LNG to the Far East will together account for 42%, an increase of 23 percentage points compared to 2022.
To support this transformation, Russia has investedThe $27 billion expansion of the Siberia-Pacific Pipeline will increase its annual oil transportation capacity from 80 million tons to 110 million tons; simultaneously, three new LNG plants will be built in the Far East region, with an expected annual production capacity increase of 15 million tons upon commissioning in 2027.
The new round of EU sanctions will inevitably accelerate the process.Russiaenergy Further (including crude oil and natural gas)Turn to the Asian market。
Secondly, the new round of sanctions has shifted its focus to Russia's massive...The "shadow tanker fleet": The European Union has blacklisted 105 suspected "shadow fleet" oil tankers. These vessels have an average age of 18 years, significantly older than the global average of 12 years for oil tankers, and are characterized by frequent flag changes and opaque management structures. The sanctions directly cut off their lifelines: EU member state ports are prohibited from allowing them to dock, EU financial institutions are banned from providing financing, and mainstream insurance companies refuse to offer insurance and reinsurance services.
From industry data, this type of oil tanker is mostly concentrated in...According to the statistical model by Clarkson Shipping Consultancy, the three main types of tankers—VLCC, Suezmax, and Aframax—will gradually exit the global shipping market due to losing their support chains. It is expected that the available global VLCC capacity will decrease by 3–5% in the short term, while Suezmax and Aframax tankers will see a reduction of 7–10%. This data is referenced from the historical case in 2018 when approximately 8% of older tankers involved with Iran ceased operations due to the inability to obtain insurance following U.S. sanctions on Iranian oil, providing a realistic reference.
In addition to capacity shortages, sanctions will also lead to increased insurance premiums and compliance costs, which will directly drive up global oil shipping freight rates.——It is expected that freight rates on routes from Europe to Asia and the United States will increase by 15–20%, with even larger increases possible on some long-haul routes. This estimate is mainly based on the freight rate fluctuations following the EU's coal embargo against Russia in 2022: at that time, freight rates for coal transport from Europe to Asia rose by 18%, mainly due to additional compliance inspection fees and rerouting costs incurred by shipowners, which is consistent with the current logic in the oil shipping market.
Specifically, the additional costs include three parts: first, the cost of obtaining compliance documentation for ships required by the EU, with an average increase per ship per trip.$5,000–8,000; second, insurance premiums; third, extended port inspection waiting times (an average increase of 24–48 hours), resulting in reduced vessel turnover rates and indirectly driving up unit capacity costs.
In terms of route selection, in order to avoid high-risk waters monitored by the EU (such as the Baltic Sea and the English Channel), some tanker companies choose alternative routes—this is a common strategy in the shipping industry to cope with sanctions. Detouring around the Cape of Good Hope in Africa increases the voyage distance between Europe and Asia from approximately...The distance increases from 11,000 km to 18,000 km, with a one-way travel time extended by 8–10 days and a rise in transportation cost of about $30 per ton. Alternative routes (such as transshipment via Southeast Asia) require an additional "ship-to-ship" transfer, with each transfer costing approximately $20,000 per vessel.
A seemingly inconspicuous yet highly impactful clause in the sanctions plan directly targets one of India's largest oil refiners.——Nayara Energy CompanyNayara EnergyThe company has been explicitly listed on the sanctions list, becoming the focal target of this round of crackdowns.
The refinery is located in Vadinar, Gujarat, India, with an annual production capacity of200010,000 tons2017Year by Russian oil company (Rosneft) United Tok (Trafigura) and Russian investment companyUCP 129Billion dollars from Essar Oil (Essar OilAcquisition.
Due to the fact that the domestic retail network only6750Therefore, the Nyarala refinery is highly dependent on exports, and its diesel and other products originally accounted for a portion of Europe's imports.8%The sanctions directly impacted the refinery's export business, while also causing a daily average of...15The disruption of tens of thousands of barrels of supply has exacerbated the diesel shortage in Europe.ARA(Amsterdam-Rotterdam-Diesel inventories in the Antwerp region have declined from the year-to-date high.32%。
ARARegional diesel inventory

It is worth mentioning that the company is owned by Rosneft (Russian Oil Company).Rosneft) Holdings49%Under Western sanctions and Indian local legal restrictions, Russian oil companies are unable to repatriate profits. It is rumored that they have initiated negotiations to sell their shares to Indian enterprises. Reliance Industries, Adani Group, and Saudi Aramco are involved in the negotiations.
Previously, India, by maintaining a neutral stance,Purchased large quantities of Russian crude oil at "discounted prices," according to maritime data agencies.AXS MarineStatistics show that so far this year, India has become the largest buyer of Russian crude oil, accounting for the largest share of its total exports.33%These low-priced crude oils are processed in India's vast refining system, transformed into clean oil products such as diesel and aviation fuel, and ultimately sold at high prices to the European market.
However, the EU Article18The new EU sanctions on "refined oil import bans" prohibit the import of any refined oil products originating from Russian crude oil, meaning that even if a third country (such as India) purchases Russian crude oil and then processes it into refined oil products, these products cannot be exported to the EU. This is also the first time the EU's "secondary sanctions" strategy has been extended to third-country enterprises.Potentially exacerbate Emerging economies 。
The new round of EU sanctions marks a more brutal phase in the energy game between Europe and Russia. With the tightening of oil price caps, the enforcement of refined oil bans, and the continued crackdown on shadow fleets, compounded by the Damocles sword of U.S. secondary sanctions, the global energy order has begun to restructure. Although the EU has temporarily intensified its energy blockade against Russia, it has paid the price of soaring energy prices and widening internal rifts. Russia, relying on alternative markets such as major Eastern powers, has maintained its energy exports but faces the challenges of technological blockades and insufficient long-term investment. Meanwhile, major Eastern powers, leveraging strategic resolve and economic resilience, have secured their own energy security while enhancing their influence in the global energy landscape.
Author: Gao Xing, Senior Market Analysis Expert
【Copyright and Disclaimer】This article is the property of PlastMatch. For business cooperation, media interviews, article reprints, or suggestions, please call the PlastMatch customer service hotline at +86-18030158354 or via email at service@zhuansushijie.com. The information and data provided by PlastMatch are for reference only and do not constitute direct advice for client decision-making. Any decisions made by clients based on such information and data, and all resulting direct or indirect losses and legal consequences, shall be borne by the clients themselves and are unrelated to PlastMatch. Unauthorized reprinting is strictly prohibited.
Most Popular
-

AI Computing Power Demand Ignites Electronic Fabrics! China Jushi Hits Limit Up! Domestic Substitution Welcomes Golden Window
-

Focus on going global! kingfa sci. leads, huitong, preter, and kumho nire follow, china’s modified plastics frenziedly expanding worldwide
-

Back-to-back major joker moves! covestro’s 1.32 million ton mdi dual-line expansion and hdi acquisition reshape global polyurethane landscape
-

Evonik Parts Ways With The Polyester Business! A Strategic Retreat By A Germany Chemical Giant And The Global Industry Shift
-

PA66 Cost and Profit: Broad-Based Weakness in the Feedstock Market Continues to Erode Cost Support for PA66 (202606)


