


European Flexible Packaging Market Trends Analysis: Regulations and Innovation Drive Sustainable Development
On September 2, the latest data published by Towards Packaging showed that the global flexible packaging market is expected to increase from USD 323.25 billion in 2025 to USD 488.72 billion in 2034, with a compound annual growth rate (CAGR) of 4.7% throughout the forecast period from 2025 to 2034.
Meanwhile, the European flexible packaging market is undergoing profound transformation, driven by environmental regulations, consumer preferences, and regional differences, moving towards greater sustainability and efficiency.
PART.01
Policies and regulations reshape the industry landscape.
The EU Packaging and Packaging Waste Regulation (PPWR) will come into effect in February 2025, requiring a 5% reduction in per capita packaging waste by 2030 and 10% by 2035, as well as mandating that the recyclability rate of packaging materials be increased to 55%. It promotes MDOPE/GRSPE (containing recycled materials) to become mainstream, whose barrier performance is close to traditional composite materials and is compatible with various formats such as stand-up pouches and flat pouches.
In addition, starting from 2030, the use of single-use plastic packaging for fruits and vegetables weighing less than 1.5 kilograms will be prohibited, forcing companies to switch to compostable materials such as wood pulp-based cellulose film and PLA metallized film. These materials can fully degrade within 12 months under industrial composting conditions.
The Circular Economy for Flexible Packaging (CEFLEX) in Europe strongly recommends that flexible packaging use single polyethylene (PE) material (with a weight proportion exceeding 90%), with other barrier components allowed to contain a maximum of 5% by weight.
PART.02
Consumer Perception and Behavioral Differentiation
According to surveys, 44% of European consumers believe that reducing food waste is key to lowering environmental impact, but only 50% of consumers recognize that soft packaging is easy to recycle (65% in Spain, 40% in Germany).
This cognitive difference leads to divergence in regional market strategies: Southern European countries focus on promoting recyclable packaging, while Northern Europe places greater emphasis on the application of bio-based materials.
For example, a Spanish dairy company adopted a 23μm cellulose metallized film customized by Kaifeng, reducing the carbon footprint by 32%; a German pet food packaging switched to microwaveable PLA film, increasing the repurchase rate by 18%.
PART.03
Regional Market Dynamics and Competitive Landscape
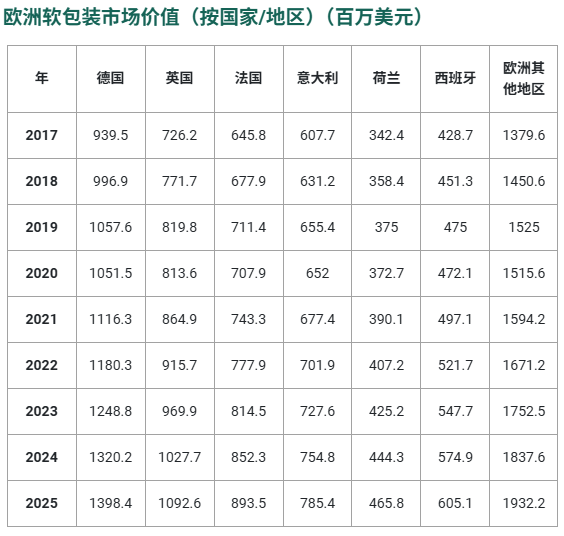
As the largest consumer in Europe (accounting for 19%), leading companies such as Amcor and Mondi have strengthened their advantages in aluminum-plastic composite technology through acquisitions, such as Constantia's acquisition of Aluflexpack.
Exports account for 33%, attracting companies like Sudpack to set up factories. In 2024, flexible packaging production is expected to grow by 12%, with a focus on developing PE/PP single-material production lines.
Due to the impact of the Plastic Packaging Tax (PPT), the usage rate of recycled plastics increased to 35% in 2024. 3D Neopac launched tubes with a 23% reduction in thickness, resulting in an 18% decrease in costs.
PART.04
Challenges and Future Prospects
Despite some progress, the current European flexible packaging sector faces bottlenecks such as insufficient recycling infrastructure (only 50% is recyclable) and high costs for bio-based materials (20-30% more expensive than petroleum-based ones). Achieving a true circular economy remains a long-term goal, as continuous recycling and reuse of materials are still needed, but market trends are clear:
E-commerce drives lightweighting.
The European food industry, particularly in snacks, ready-to-eat foods, and frozen foods, relies on flexible packaging to extend shelf life and seek portability. For example, the demand for frozen food bags is increasing by 8% annually, requiring resistance to low temperatures of -20°C and an oxygen barrier of less than 5 cm³/m²·day.
2 Circular Economy Closed Loop
Rukai Peak has collaborated with Unilever to launch carbon footprint labels, achieving full traceability from raw materials to recycling. The bioplastics market share is expected to reach 25% by 2030.
The European flexible packaging market is accelerating its transformation towards high recyclability, low environmental impact, and high added value, driven by policy enforcement, technological breakthroughs, and consumption upgrades. It is expected to become the "core testing ground" for global green packaging innovation over the next five years.
【Copyright and Disclaimer】The above information is collected and organized by PlastMatch. The copyright belongs to the original author. This article is reprinted for the purpose of providing more information, and it does not imply that PlastMatch endorses the views expressed in the article or guarantees its accuracy. If there are any errors in the source attribution or if your legitimate rights have been infringed, please contact us, and we will promptly correct or remove the content. If other media, websites, or individuals use the aforementioned content, they must clearly indicate the original source and origin of the work and assume legal responsibility on their own.
Most Popular
-

AI Computing Power Demand Ignites Electronic Fabrics! China Jushi Hits Limit Up! Domestic Substitution Welcomes Golden Window
-

Focus on going global! kingfa sci. leads, huitong, preter, and kumho nire follow, china’s modified plastics frenziedly expanding worldwide
-

Back-to-back major joker moves! covestro’s 1.32 million ton mdi dual-line expansion and hdi acquisition reshape global polyurethane landscape
-

Evonik Parts Ways With The Polyester Business! A Strategic Retreat By A Germany Chemical Giant And The Global Industry Shift
-

PA66 Cost and Profit: Broad-Based Weakness in the Feedstock Market Continues to Erode Cost Support for PA66 (202606)


