


End of Expansion Cycle, Turning Point in PTA Industry Becoming Apparent
Demand growth absorbs advantageous production capacity, PTA landscape optimization "anti-involution" is imminent.
In recent years, with the continuous rise in demand from downstream sectors such as textiles, apparel, and consumer goods materials, China's PTA (Purified Terephthalic Acid) industry has shown a new development trend amidst capacity expansion and structural changes.
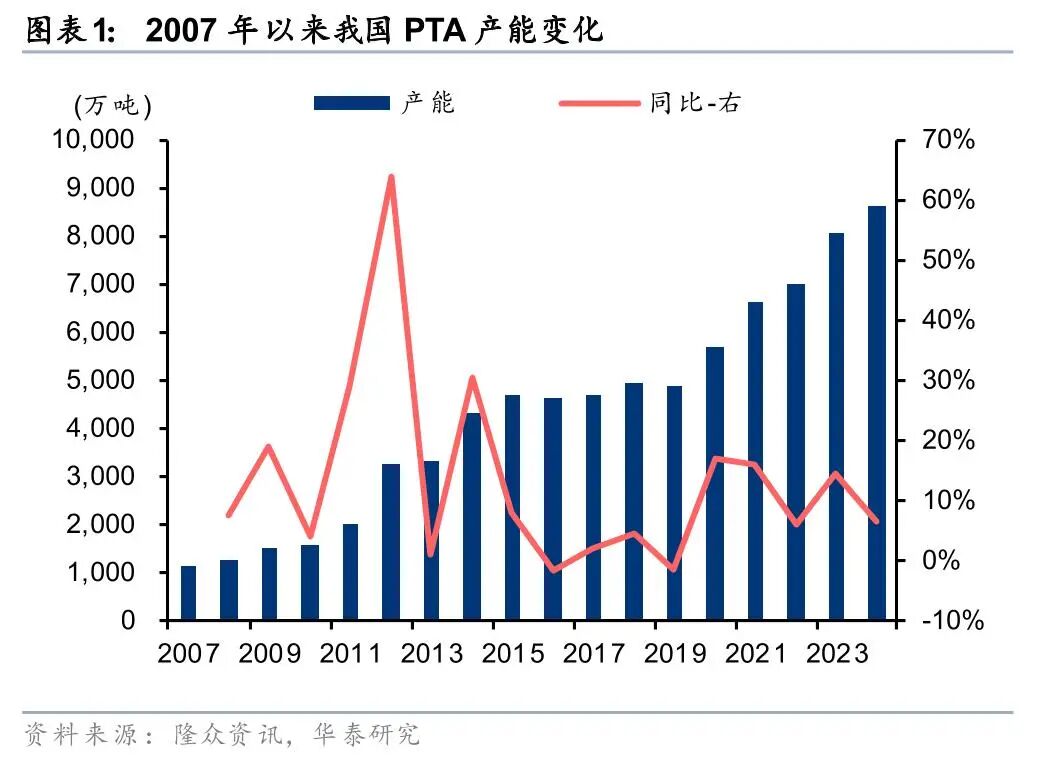
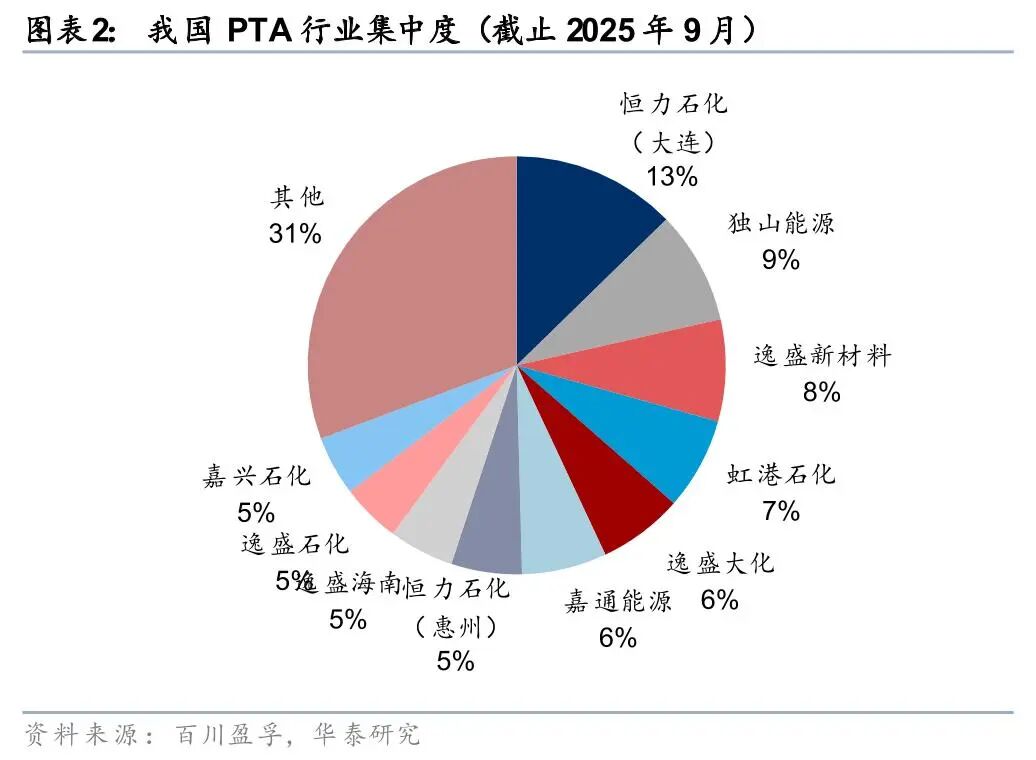
Since 2020, the production capacity of PTA in our country has seen a significant increase of 80%. Since then, the industry operating rate has remained at a healthy level.However, the profit slump has persisted for 13 years, primarily due to the continuous internal competition driven by the promotion of new technologies after 2018. By 2025, the market concentration of the top five companies (CR5) in China's PTA industry will reach 70%, with leading enterprises having a high proportion of new technology production capacity. Additionally, there will be no new production capacity in the PTA industry from 2026 to 2027. Given the limited space for technological optimization, outdated production capacity will gradually exit the market, and an "anti-involution" trend in the industry structure is set to emerge.
The expansion cycle is nearing its end, and the concentration of leading enterprises has further increased.
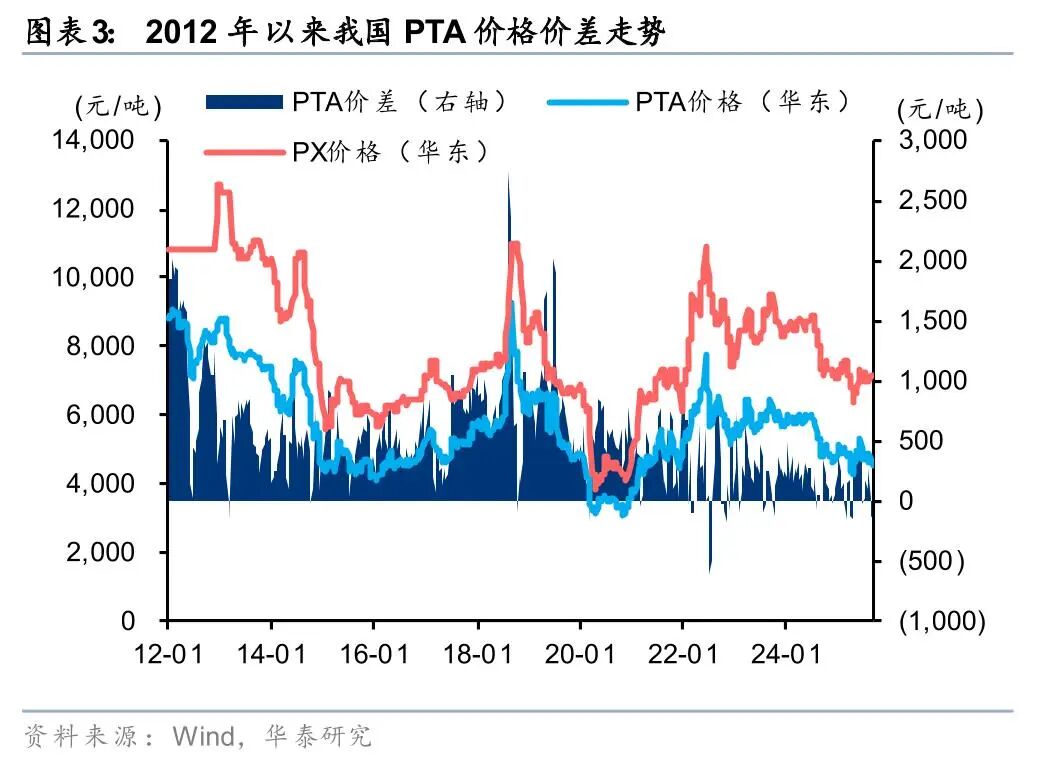
PTA, as the core raw material for polyester fibers, polyester bottle chips, and polyester films, has undergone two rounds of capacity expansion since 2010. By September 2025, China's effective PTA production capacity is expected to reach 91.35 million tons. The rapid approach to saturation on the supply side has led to the product price differentials remaining at low levels for nearly five years.
In terms of capacity distribution, China's PTA production capacity is highly concentrated among five leading companies. Hengli Petrochemical's Dalian and Huizhou facilities combined have a capacity of 16.6 million tons; Tongkun Group has a capacity of 10.2 million tons; Xinfengming Group has a capacity of 8 million tons; Yisheng (jointly owned by Hengyi Petrochemical and Rongsheng Petrochemical) has a combined capacity of 22 million tons; and a plant in Lianyungang has a capacity of 6.5 million tons. The industry concentration ratio (CR5) is nearly 70%, and there are no plans for additional capacity in the next two years, further solidifying the industry structure dominated by leading companies.
Technological iteration drives cost optimization, putting pressure on the profits of small-scale old facilities.
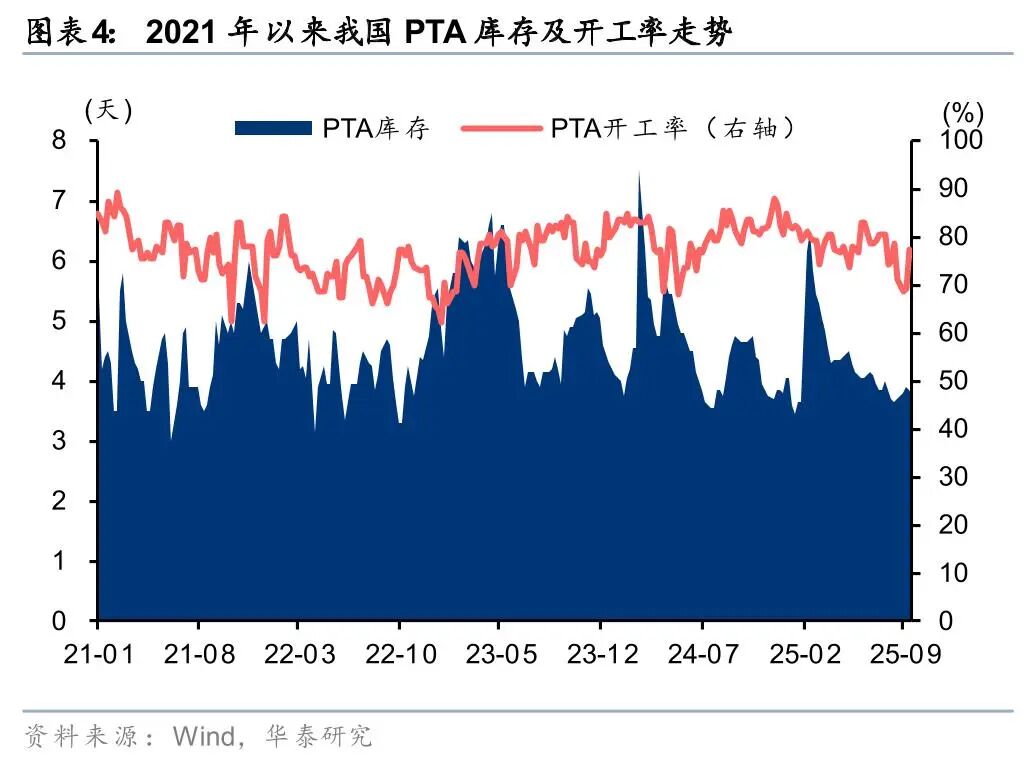
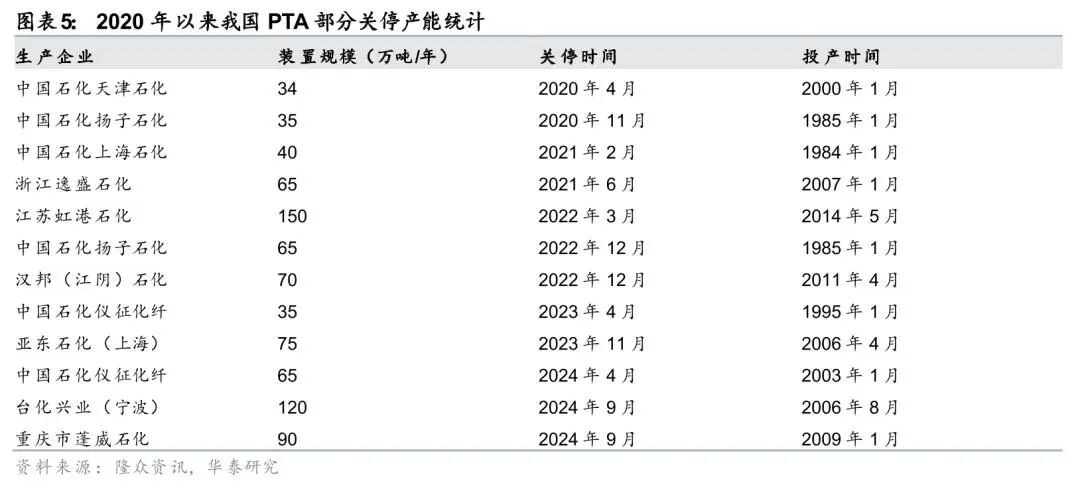
According to environmental assessment reports from various companies, the expansion cycle that began in 2019 has seen the adoption of new-generation technologies developed by BP, INVISTA, and others in newly constructed facilities. These new facilities each have a scale of 2.5 million tons or more, showing significant improvements in energy consumption, material usage, and environmental protection compared to the previous generation of facilities. However, the widespread application of new technology has intensified industry competition, resulting in a five-year period of downturn for the industry. Nevertheless, the cost advantages of the new facilities are gradually becoming apparent, forcing the phase-out of older, high-cost facilities. According to data from Longzhong Information, since 2020, outdated facilities with a capacity of less than 1.5 million tons have been gradually shut down. Currently, the nominal operating rate of the domestic PTA industry is around 75%, with new technology capacities achieving full production. The industry's supply structure is moving towards optimization.
Industry profits are expected to bottom out and rebound, benefiting leading companies in the sector.
Based on the comprehensive analysis of various factors, the domestic "anti-involution" policies and the technological updates in the industry will work together to continuously optimize the supply structure of the PTA industry. At the same time, the demand for textile, clothing, and consumption both domestically and internationally is expected to steadily increase. Against this backdrop, the PTA industry is likely to see a significant rebound in profits. Leading companies in the industry, with a high proportion of new installations, will benefit first from this round of industry transformation due to their cost advantages and economies of scale, ushering in new development opportunities.
【Copyright and Disclaimer】The above information is collected and organized by PlastMatch. The copyright belongs to the original author. This article is reprinted for the purpose of providing more information, and it does not imply that PlastMatch endorses the views expressed in the article or guarantees its accuracy. If there are any errors in the source attribution or if your legitimate rights have been infringed, please contact us, and we will promptly correct or remove the content. If other media, websites, or individuals use the aforementioned content, they must clearly indicate the original source and origin of the work and assume legal responsibility on their own.
Most Popular
-

AI Computing Power Demand Ignites Electronic Fabrics! China Jushi Hits Limit Up! Domestic Substitution Welcomes Golden Window
-

Focus on going global! kingfa sci. leads, huitong, preter, and kumho nire follow, china’s modified plastics frenziedly expanding worldwide
-

Back-to-back major joker moves! covestro’s 1.32 million ton mdi dual-line expansion and hdi acquisition reshape global polyurethane landscape
-

Evonik Parts Ways With The Polyester Business! A Strategic Retreat By A Germany Chemical Giant And The Global Industry Shift
-

PA66 Cost and Profit: Broad-Based Weakness in the Feedstock Market Continues to Erode Cost Support for PA66 (202606)


