


Dow Faces Decline Across All Divisions, Total Losses Reach 967 Million!
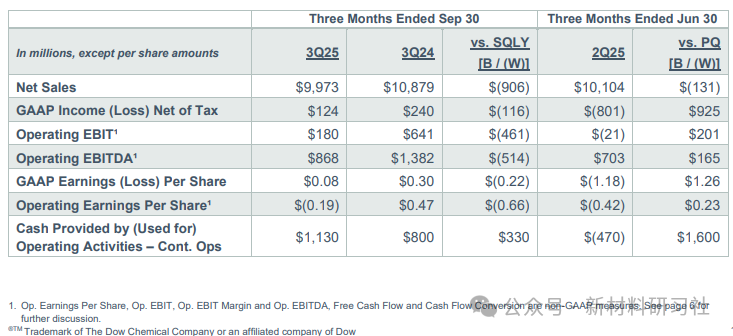
On October 23, Dow Chemical released its third-quarter performance data, showing a decline across all operating segments. The company's net sales for the third quarter were approximately $10 billion, a year-on-year decrease of 8%, with all operating segments experiencing a downturn. Under Generally Accepted Accounting Principles (GAAP), net profit was $124 million (approximately 880 million yuan), marking a return to profitability from a loss. Operating EBITDA was approximately $870 million, a year-on-year decline of 37%. Based on the net profit for the first three quarters, Dow has recorded a cumulative loss of $967 million this year.
It is worth mentioning that with Dow's newly built polyethylene and alkoxylation assets on the U.S. Gulf Coast, these new facilities have brought strong demand, which also indicates that Dow has achieved sequential growth in sales and profitability in key end markets.
Net sales were $10 billion, down 8% year-over-year, reflecting declines across all operating segments. Sequentially, net sales decreased by 1% as growth in the industrial intermediates and infrastructure sectors was significantly offset by declines in the packaging and specialty plastics and performance materials and coatings sectors.
Sales decreased by 1% year-on-year, with the decline in Europe, the Middle East, Africa, and India (EMEAI) offset by growth in the United States and Canada as well as the Asia-Pacific region. On a quarter-on-quarter basis, sales increased by 1%, benefiting from the startup of new assets along the U.S. Gulf Coast by Dow. Growth in industrial intermediates and infrastructure was partially offset by a decline in packaging and specialty plastics, due to reduced sales of commercial hydrocarbons.
Local prices decreased by 8% year-on-year and 3% month-on-month.
According to Generally Accepted Accounting Principles (GAAP), the net profit was $124 million. Operating EBIT (Earnings Before Interest and Taxes) was $180 million, a year-over-year decrease of $461 million. This was mainly due to declines in prices and equity earnings, but was partially offset by the benefits from the company's cost-cutting actions. Quarter-over-quarter, operating EBIT increased by $201 million, thanks to significant progress in cost reductions and a reduction in planned maintenance activities, but was partially offset by the impact of price declines across all operating segments.
The earnings per share calculated according to generally accepted auditing standards is $0.08; the operating earnings per share is a loss of $0.19, compared to an operating earnings per share of $0.47 in the same period last year and a loss of $0.42 in the previous quarter. The operating earnings per share excludes significant items totaling $0.27 per share, primarily driven by a one-time favorable tax adjustment and gains from the sale of the company’s 50% stake in the DowAksa joint venture.
Cash provided by operating activities—continuing operations amounted to $1.1 billion, an increase of $330 million year-on-year, driven by improvements in working capital. In contrast, the previous quarter saw an increase of $1.6 billion, primarily driven by similar improvements in working capital, as well as advance payments in low-carbon solutions and other long-term supply agreements.
The net sales of the Packaging and Specialty Plastics segment for the quarter were $4.9 billion, a decrease of 11% year-over-year. Local prices decreased by 10% year-over-year, mainly due to the decline in downstream polymer prices. Exchange rates contributed to a 1% increase in net sales. Volume decreased by 1% year-over-year, driven by a decline in licensing income and merchant olefins sales, although this was partially offset by an increase in polyethylene sales. Quarter-over-quarter, net sales also declined, primarily due to lower prices for downstream polymers and olefins.
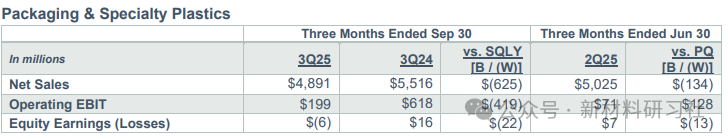
The equity loss for this segment was $6 million, a decrease of $22 million compared to the previous year. This was due to a decline in the comprehensive profit margin of the Kuwait joint venture and reduced supply availability caused by an unexpected incident at Sadara in July. Currently, the affected assets have been restored and are operating normally. In contrast, equity earnings decreased by $13 million, primarily due to greater losses at Sadara.
Operating EBIT was $199 million, a decrease of $419 million compared to the same period last year, mainly due to a reduction in overall profit margins. Operating EBIT increased by $128 million sequentially, benefiting from higher overall profit margins, improved operating rates, our new polyethylene production unit in Freeport, Texas, and reduced fixed costs.
The net sales reported by the packaging and specialty plastics business declined compared to the same period last year, primarily due to lower downstream polymer prices and reduced licensing income. However, increased demand for flexible packaging applications partially offset this impact. On a sequential basis, net sales remained flat as the growth in flexible packaging demand was offset by the decline in prices.
The net sales of the industrial intermediates and infrastructure sectors amounted to $2.8 billion, representing a 4% decrease year-on-year. Local prices dropped by 8% year-on-year, reflecting declines in these two business areas. Exchange rates increased net sales by 2%. Volume increased by 2% year-on-year, driven by growth in the United States and Canada in these business areas. Quarter-on-quarter, net sales grew by 2%, as the volume growth in all regions was partially offset by price declines.
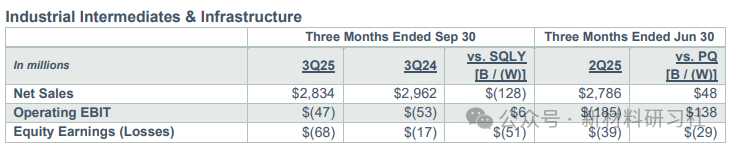
The equity loss of the department amounted to $68 million, compared to $17 million in the same period last year, primarily due to a decline in the combined margins of the Sadara and Kuwait joint ventures. In the previous quarter, the department's equity loss was $39 million. On a quarter-on-quarter basis, the decline in earnings was due to greater losses experienced by Sadara following the unforeseen events mentioned prior to July.
Operating EBIT increased by $6 million compared to the same period last year, driven by higher operational efficiency and lower fixed costs, though partially offset by lower prices. Quarter-over-quarter, Operating EBIT rose by $138 million, benefiting from a reduction in planned maintenance activities and increased output in two business areas. Additionally, the startup of the new alkylation unit in West Deer Park, Texas, also provided support.
The net sales of the Performance Materials and Coatings segment in the quarter were $2.1 billion, a decrease of 6% compared to the same period last year. The decline in both business areas was due to a 5% year-over-year decrease in local prices. Currency effects increased net sales by 1%. Sales volume decreased by 2% year-over-year, primarily due to a drop in sales in the Consumer Solutions area, which was caused by reduced upstream siloxane supply. Quarter-over-quarter, net sales declined by 2%, attributed to lower prices and a seasonal decrease in demand for coatings, although growth in the Consumer Solutions area partially offset this impact.
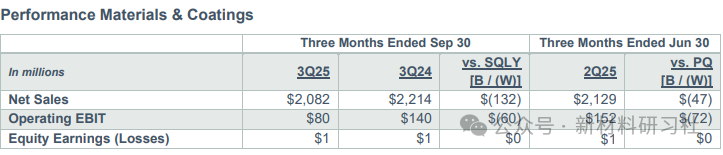
Operating EBIT decreased by $60 million year-over-year, primarily due to price reductions, partially offset by a reduction in fixed costs. Sequentially, operating EBIT decreased by $72 million, mainly due to margin compression in upstream silicones and seasonally reduced production, partially offset by a reduction in fixed costs.
【Copyright and Disclaimer】The above information is collected and organized by PlastMatch. The copyright belongs to the original author. This article is reprinted for the purpose of providing more information, and it does not imply that PlastMatch endorses the views expressed in the article or guarantees its accuracy. If there are any errors in the source attribution or if your legitimate rights have been infringed, please contact us, and we will promptly correct or remove the content. If other media, websites, or individuals use the aforementioned content, they must clearly indicate the original source and origin of the work and assume legal responsibility on their own.
Most Popular
-

AI Computing Power Demand Ignites Electronic Fabrics! China Jushi Hits Limit Up! Domestic Substitution Welcomes Golden Window
-

Focus on going global! kingfa sci. leads, huitong, preter, and kumho nire follow, china’s modified plastics frenziedly expanding worldwide
-

Back-to-back major joker moves! covestro’s 1.32 million ton mdi dual-line expansion and hdi acquisition reshape global polyurethane landscape
-

Evonik Parts Ways With The Polyester Business! A Strategic Retreat By A Germany Chemical Giant And The Global Industry Shift
-

PA66 Cost and Profit: Broad-Based Weakness in the Feedstock Market Continues to Erode Cost Support for PA66 (202606)


