


Dow Chemical Posts a Loss of 7.8 Billion Yuan
According to DT New Materials, on July 24, Dow Chemical released its second-quarter performance data, showing a decline in all departments' performance and an expanded loss. This follows BASF, the world's number one company, announcing an 81% drop in its second-quarter net profit, marking another (world's third) giant demonstrating market chill and helplessness.
Overall, looking at the data:
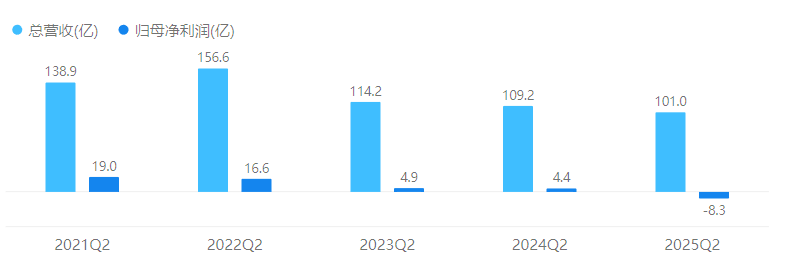
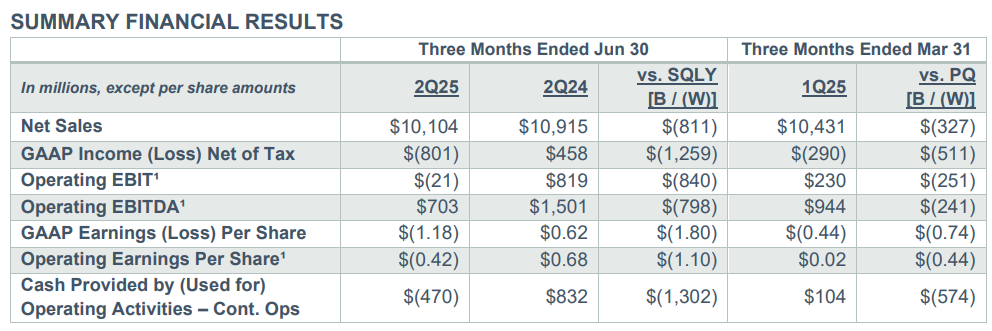
Net sales: 10.1 billion USD, down 7% year-on-year, with declines across all operating segments. Down 3% quarter-on-quarter (1Q25 was 10.4 billion USD).
(2) Sales: decreased by 1% year-on-year and 2% month-on-month. Although there was growth in the United States and Canada, it was offset by declines in Europe, the Middle East, Africa, and India.
(3) Price: A year-on-year decrease of 7% and a month-on-month decrease of 3%, mainly due to the pressure on global chemical product prices.
(4) GAAP net profit: a loss of $801 million. In the first quarter of 2025, this figure was -$290 million, meaning the company's total loss for the first half of the year reached $1.091 billion, approximately 7.8 billion RMB!
(5) Operating EBIT: a loss of USD 21 million, a year-on-year decrease of USD 840 million, mainly due to price declines and reduced equity earnings. A quarter-on-quarter decrease of USD 251 million, although supported by favorable currency exchange rates and company cost-cutting plans, was offset by declines in the packaging and specialty plastics segments.
(6) Cash flow from operating activities: -$470 million, a year-on-year decrease of $1.3 billion, and a quarter-on-quarter decrease of $574 million, primarily due to compressed profit margins.
Dow recently won a lawsuit against Nova Chemicals and will receive an additional CAD 1.62 billion (approximately RMB 8.5274 billion) in compensation, which is expected to be paid in the fourth quarter of 2025. This will significantly improve the company's overall financial data for this year.
By department
Packaging and Specialty Plastics Department
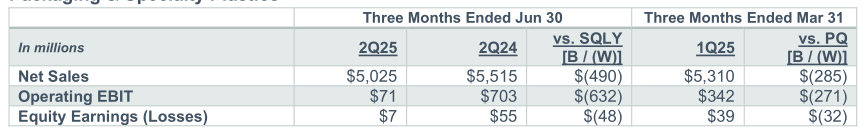
(1) Net sales: $5 billion, down 9% year-on-year, mainly due to a decline in polymer prices and reduced ethylene sales, as a result of the commissioning of Poly-7, which will bring the ethylene supply and demand in the US Gulf Coast into balance.
(2) Operating EBIT: USD 71 million, a year-on-year decrease of 89%, and a quarter-on-quarter decrease of USD 271 million.
In the two major segments, net sales of the packaging and specialty plastics business decreased year-on-year, mainly driven by a decline in downstream polymer prices, the divestiture of the lamination adhesive business, and a decrease in demand for infrastructure applications. Net sales of the hydrocarbons and energy business decreased year-on-year, primarily due to a decline in aromatics prices, partially offset by an increase in energy sales.
Industrial Intermediates and Infrastructure Sector
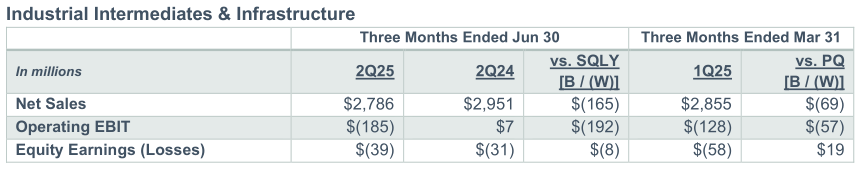
Net sales: $2.8 billion, down 6% year-on-year and 2% quarter-on-quarter, mainly due to a decrease in both price and volume.
(2) Sales volume: Decreased by 2% year-on-year, mainly due to a decline in sales of polyurethanes and construction chemicals, partially offset by growth in sales of industrial solutions.
(3) Operating Earnings Before Interest and Taxes (Op. EBIT): Loss of $185 million (compared to a profit in the previous year).
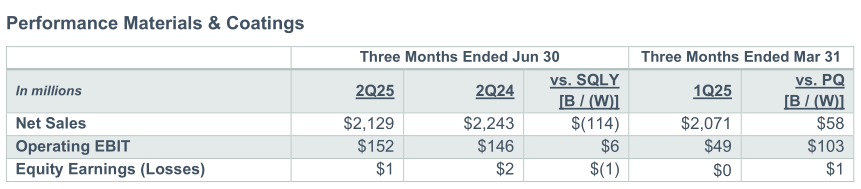
High Performance Materials and Coatings Department
(1) Net sales: $2.1 billion, down 5% year-over-year. Sequential growth of 3%, primarily driven by seasonal demand increase in architectural coatings and growth in downstream silicone sales, with both businesses achieving growth.
(2) Sales: down 3% year-on-year.
(3) Operating EBIT: increased by USD 6 million year-over-year and USD 103 million quarter-over-quarter.
From the perspective of the two major segments: the net sales of the consumer solutions business declined year-on-year, as the increase in downstream silicone sales was offset by price declines and a decrease in upstream siloxane sales. The quarter-on-quarter growth was driven by increased downstream silicone demand, mainly from transportation, personal care, and industrial applications. The net sales of the coatings and performance monomers business decreased year-on-year, primarily due to the continued pressure on the real estate market and the resulting decline in coatings demand. Quarter-on-quarter growth was driven by the seasonal increase in demand for architectural coatings, partially offset by a decline in acrylic monomer sales.
Looking ahead, Dow Chemical stated that the commissioning of recent growth projects (all of which will be put into operation in the third quarter), together with long-term strategic investments, will enhance Dow’s position in higher-value applications and attractive end markets. In addition, structural improvements to the cost base, optimization of the global asset footprint, and a track record of operational excellence will strengthen its competitive advantage.
Recently, Dow Chemical announced the closure of three upstream assets in Europe as part of its asset optimization efforts. These include the ethylene cracker in Böhlen, Germany, the chlor-alkali and vinyl (CAV) assets in Schkopau, Germany, and the basic silicones plant in Barry, UK. Additionally, in June, Dow announced the sale of its 50% stake in the joint venture DowAksa, a global leader in industrial-grade carbon fiber manufacturing, to its joint venture partner, Turkey's Aksa.
This move is a continuation of more than 20 “asset actions” initiated by Dow since 2023. Previously, Dow had closed the polyether polyols plant in San Lorenzo, Argentina, the alkoxylation plant in the Nangang Industrial Zone, Taiwan, and sold non-core assets such as its flexible packaging adhesives business.
【Copyright and Disclaimer】The above information is collected and organized by PlastMatch. The copyright belongs to the original author. This article is reprinted for the purpose of providing more information, and it does not imply that PlastMatch endorses the views expressed in the article or guarantees its accuracy. If there are any errors in the source attribution or if your legitimate rights have been infringed, please contact us, and we will promptly correct or remove the content. If other media, websites, or individuals use the aforementioned content, they must clearly indicate the original source and origin of the work and assume legal responsibility on their own.
Most Popular
-

AI Computing Power Demand Ignites Electronic Fabrics! China Jushi Hits Limit Up! Domestic Substitution Welcomes Golden Window
-

Focus on going global! kingfa sci. leads, huitong, preter, and kumho nire follow, china’s modified plastics frenziedly expanding worldwide
-

Back-to-back major joker moves! covestro’s 1.32 million ton mdi dual-line expansion and hdi acquisition reshape global polyurethane landscape
-

Evonik Parts Ways With The Polyester Business! A Strategic Retreat By A Germany Chemical Giant And The Global Industry Shift
-

PA66 Cost and Profit: Broad-Based Weakness in the Feedstock Market Continues to Erode Cost Support for PA66 (202606)


