


Compass for Going Global | What Packaging Do Overseas Buyers Want to Source from China?
CPiS2025 has reached a strategic cooperation with international authoritative chamber of commerce organizations, and will carefully organize international packaging buyers with packaging procurement needs to form an overseas buyers group. They will personally attend CPiS2025 to participate in packaging trade对接 activities and booth visits.
CPiS2025
International perspective, diverse cooperation opportunities
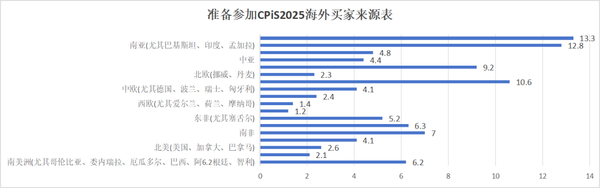
CPiS2025 attracted buyers from many countries around the world. In terms of source distribution (see Figure 1), buyers from Southeast Asia accounted for 13.3%, and those from South Asia accounted for 12.8%, ranking at the top.
In Southeast Asia, the economy has developed rapidly in recent years, leading to a continuous growth in demand for packaging products. The high level of attention indicates that the local market has huge potential, and Chinese packaging companies can take advantage of this opportunity to further explore business opportunities in the region. South Asia, with its large population and vast consumer market, also has significant demand for various packaging products, providing companies with ample space for business expansion.
CPiS2025
Analysis of Overseas Buyers Sector
Latest data (see Figure 2) shows that overseas buyers come predominantly from the Food / Snack Food industry, accounting for 21.8%, followed by the Personal Care industry at 14.2%, and Dairy at 12.2%. The food and personal care industries are key areas for packaging demand among overseas buyers, with a particular emphasis on the procurement of food packaging materials and finished products.
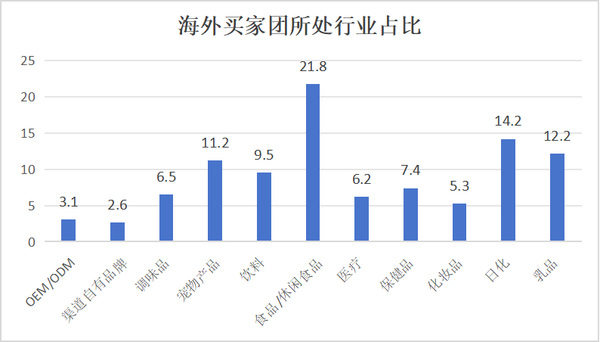
Figure 2
CPiS2025
Overseas Buyer Procurement Analysis
Overseas buyers show varying levels of interest in different packaging types. Flexible plastic packaging garners the highest attention, accounting for 22.9% (see Figure 3), followed closely by rigid plastic packaging and paper packaging. This aligns with the fact that food and beverage packaging products and materials constitute 16.6% of procurement (see Figure 4).
Flexible plastic packaging is widely used in industries such as food and daily chemicals due to its relatively low cost, strong plasticity, and convenience in processing and transportation, making it favored by overseas buyers. Paper packaging has gradually increased its market share in recent years due to its environmental advantages, especially in countries and regions with higher environmental requirements, where it has gained increasing attention. The higher proportion of food and beverage packaging products and materials in procurement further confirms the strong demand for packaging in the food industry, providing clear guidance for packaging companies in product development and production directions.
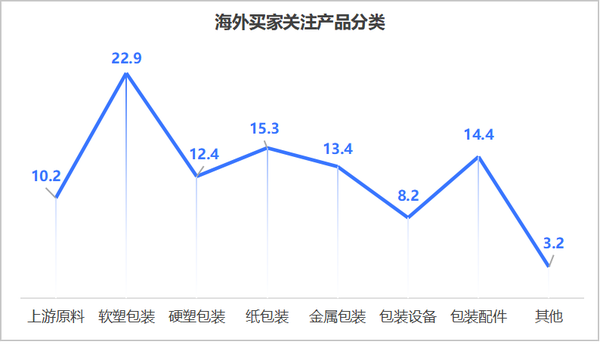
Figure 3
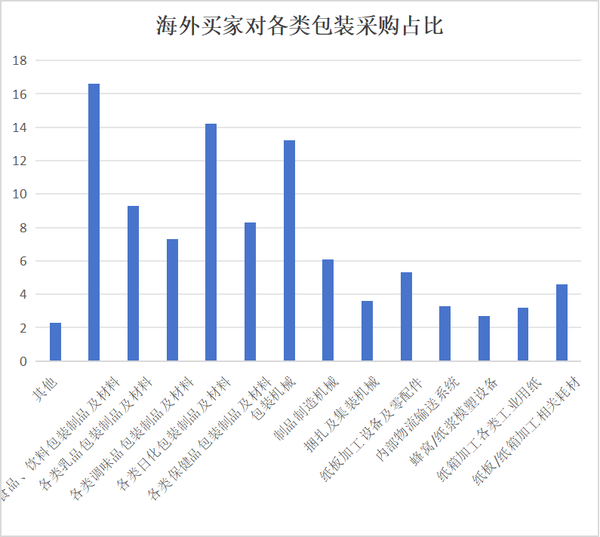
Figure 4
【Copyright and Disclaimer】The above information is collected and organized by PlastMatch. The copyright belongs to the original author. This article is reprinted for the purpose of providing more information, and it does not imply that PlastMatch endorses the views expressed in the article or guarantees its accuracy. If there are any errors in the source attribution or if your legitimate rights have been infringed, please contact us, and we will promptly correct or remove the content. If other media, websites, or individuals use the aforementioned content, they must clearly indicate the original source and origin of the work and assume legal responsibility on their own.
Most Popular
-

AI Computing Power Demand Ignites Electronic Fabrics! China Jushi Hits Limit Up! Domestic Substitution Welcomes Golden Window
-

Focus on going global! kingfa sci. leads, huitong, preter, and kumho nire follow, china’s modified plastics frenziedly expanding worldwide
-

Back-to-back major joker moves! covestro’s 1.32 million ton mdi dual-line expansion and hdi acquisition reshape global polyurethane landscape
-

Evonik Parts Ways With The Polyester Business! A Strategic Retreat By A Germany Chemical Giant And The Global Industry Shift
-

PA66 Cost and Profit: Broad-Based Weakness in the Feedstock Market Continues to Erode Cost Support for PA66 (202606)


